dichasus-adxx Dataset: ARENA2036: Distributed setup in industrial environment at 3.4GHz
rev2
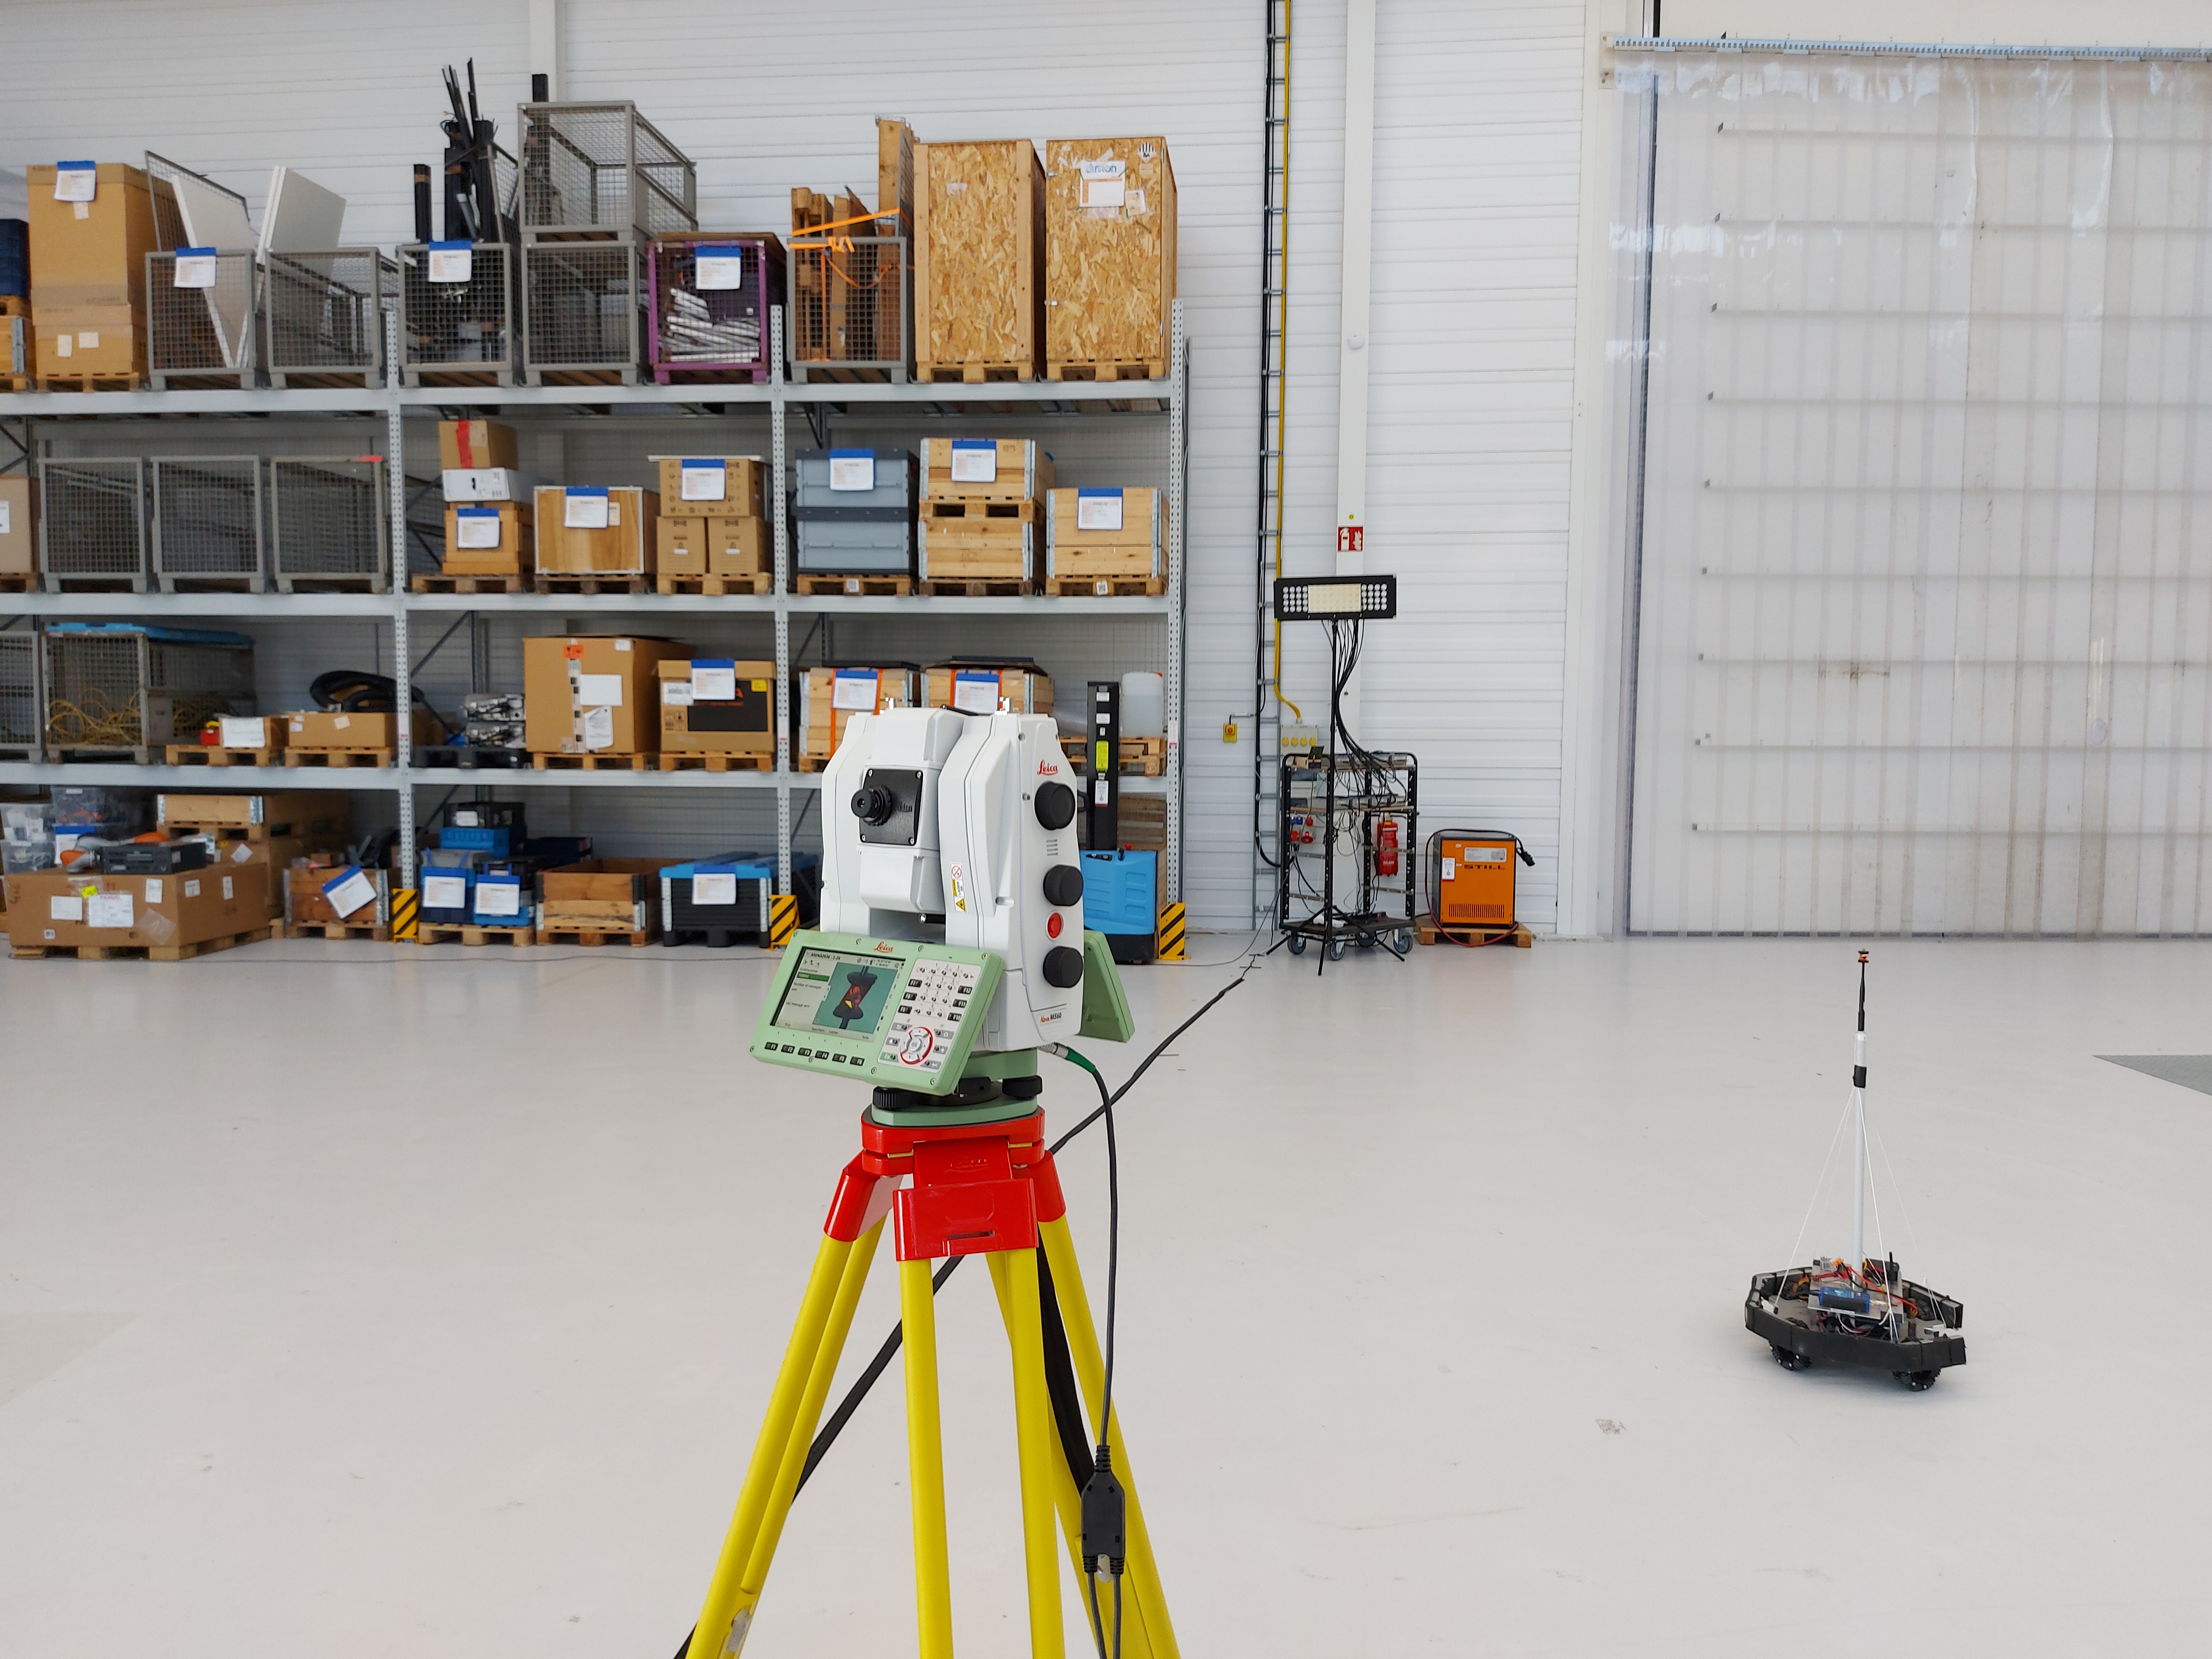
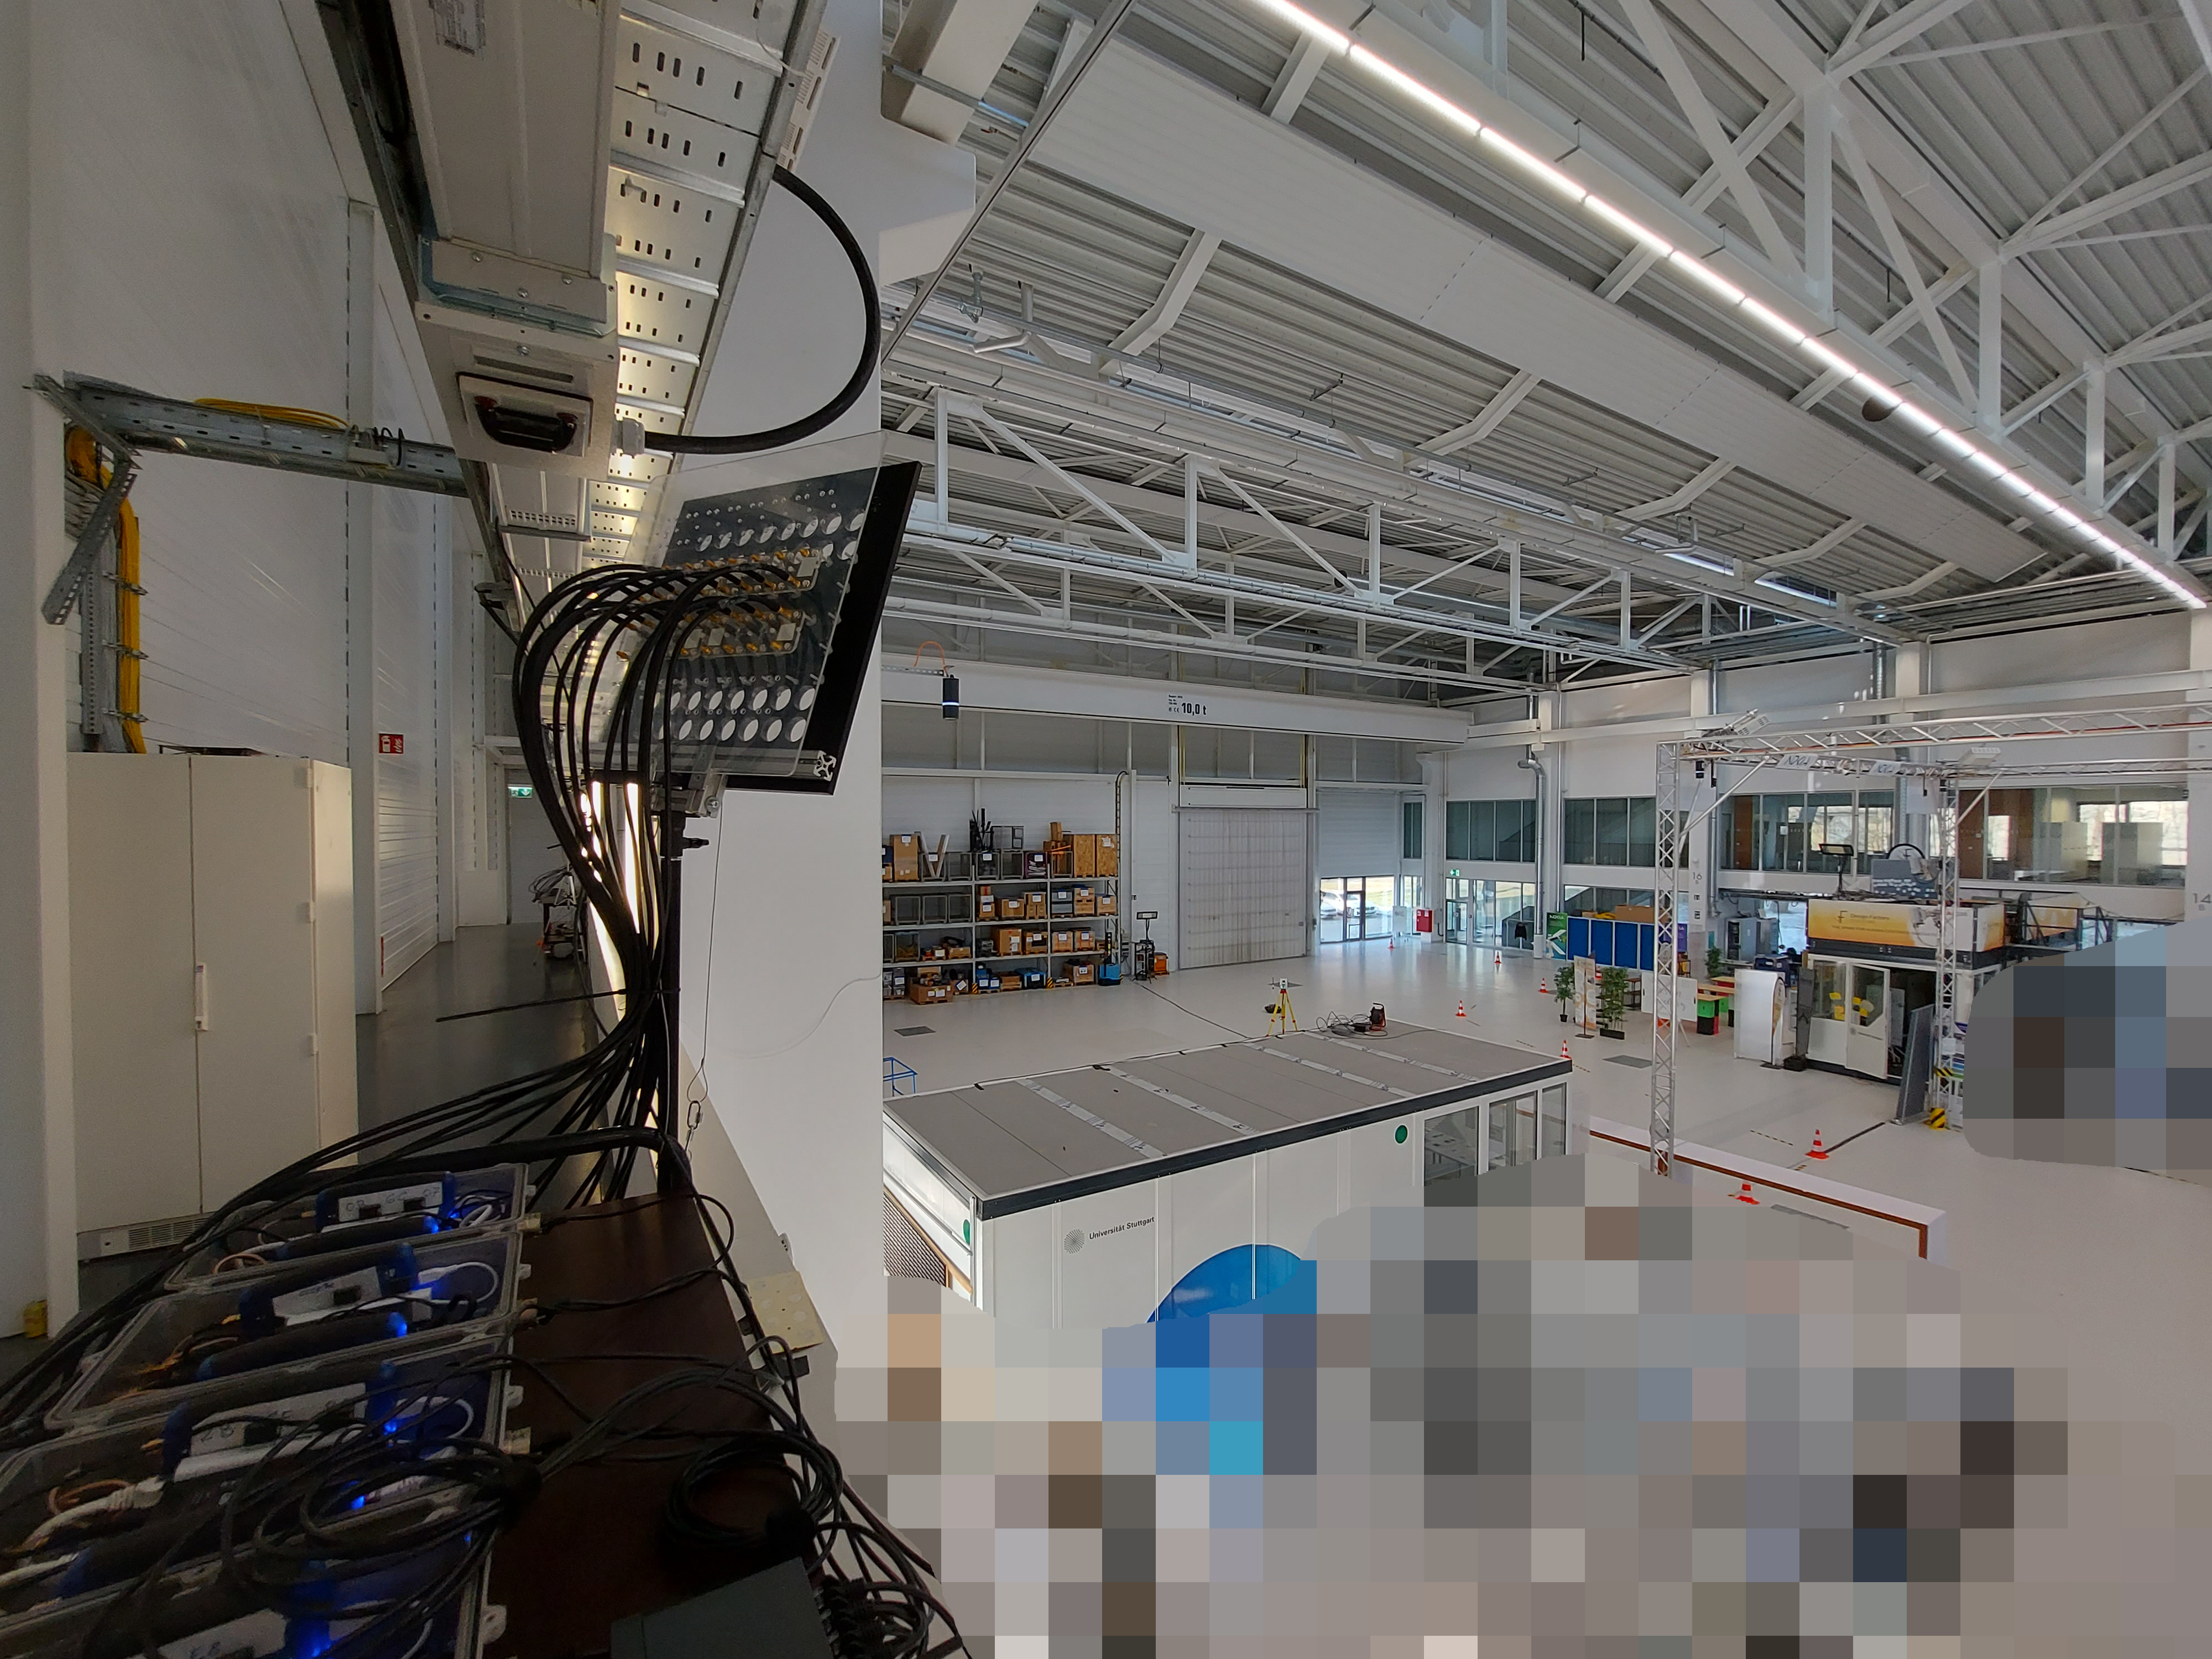
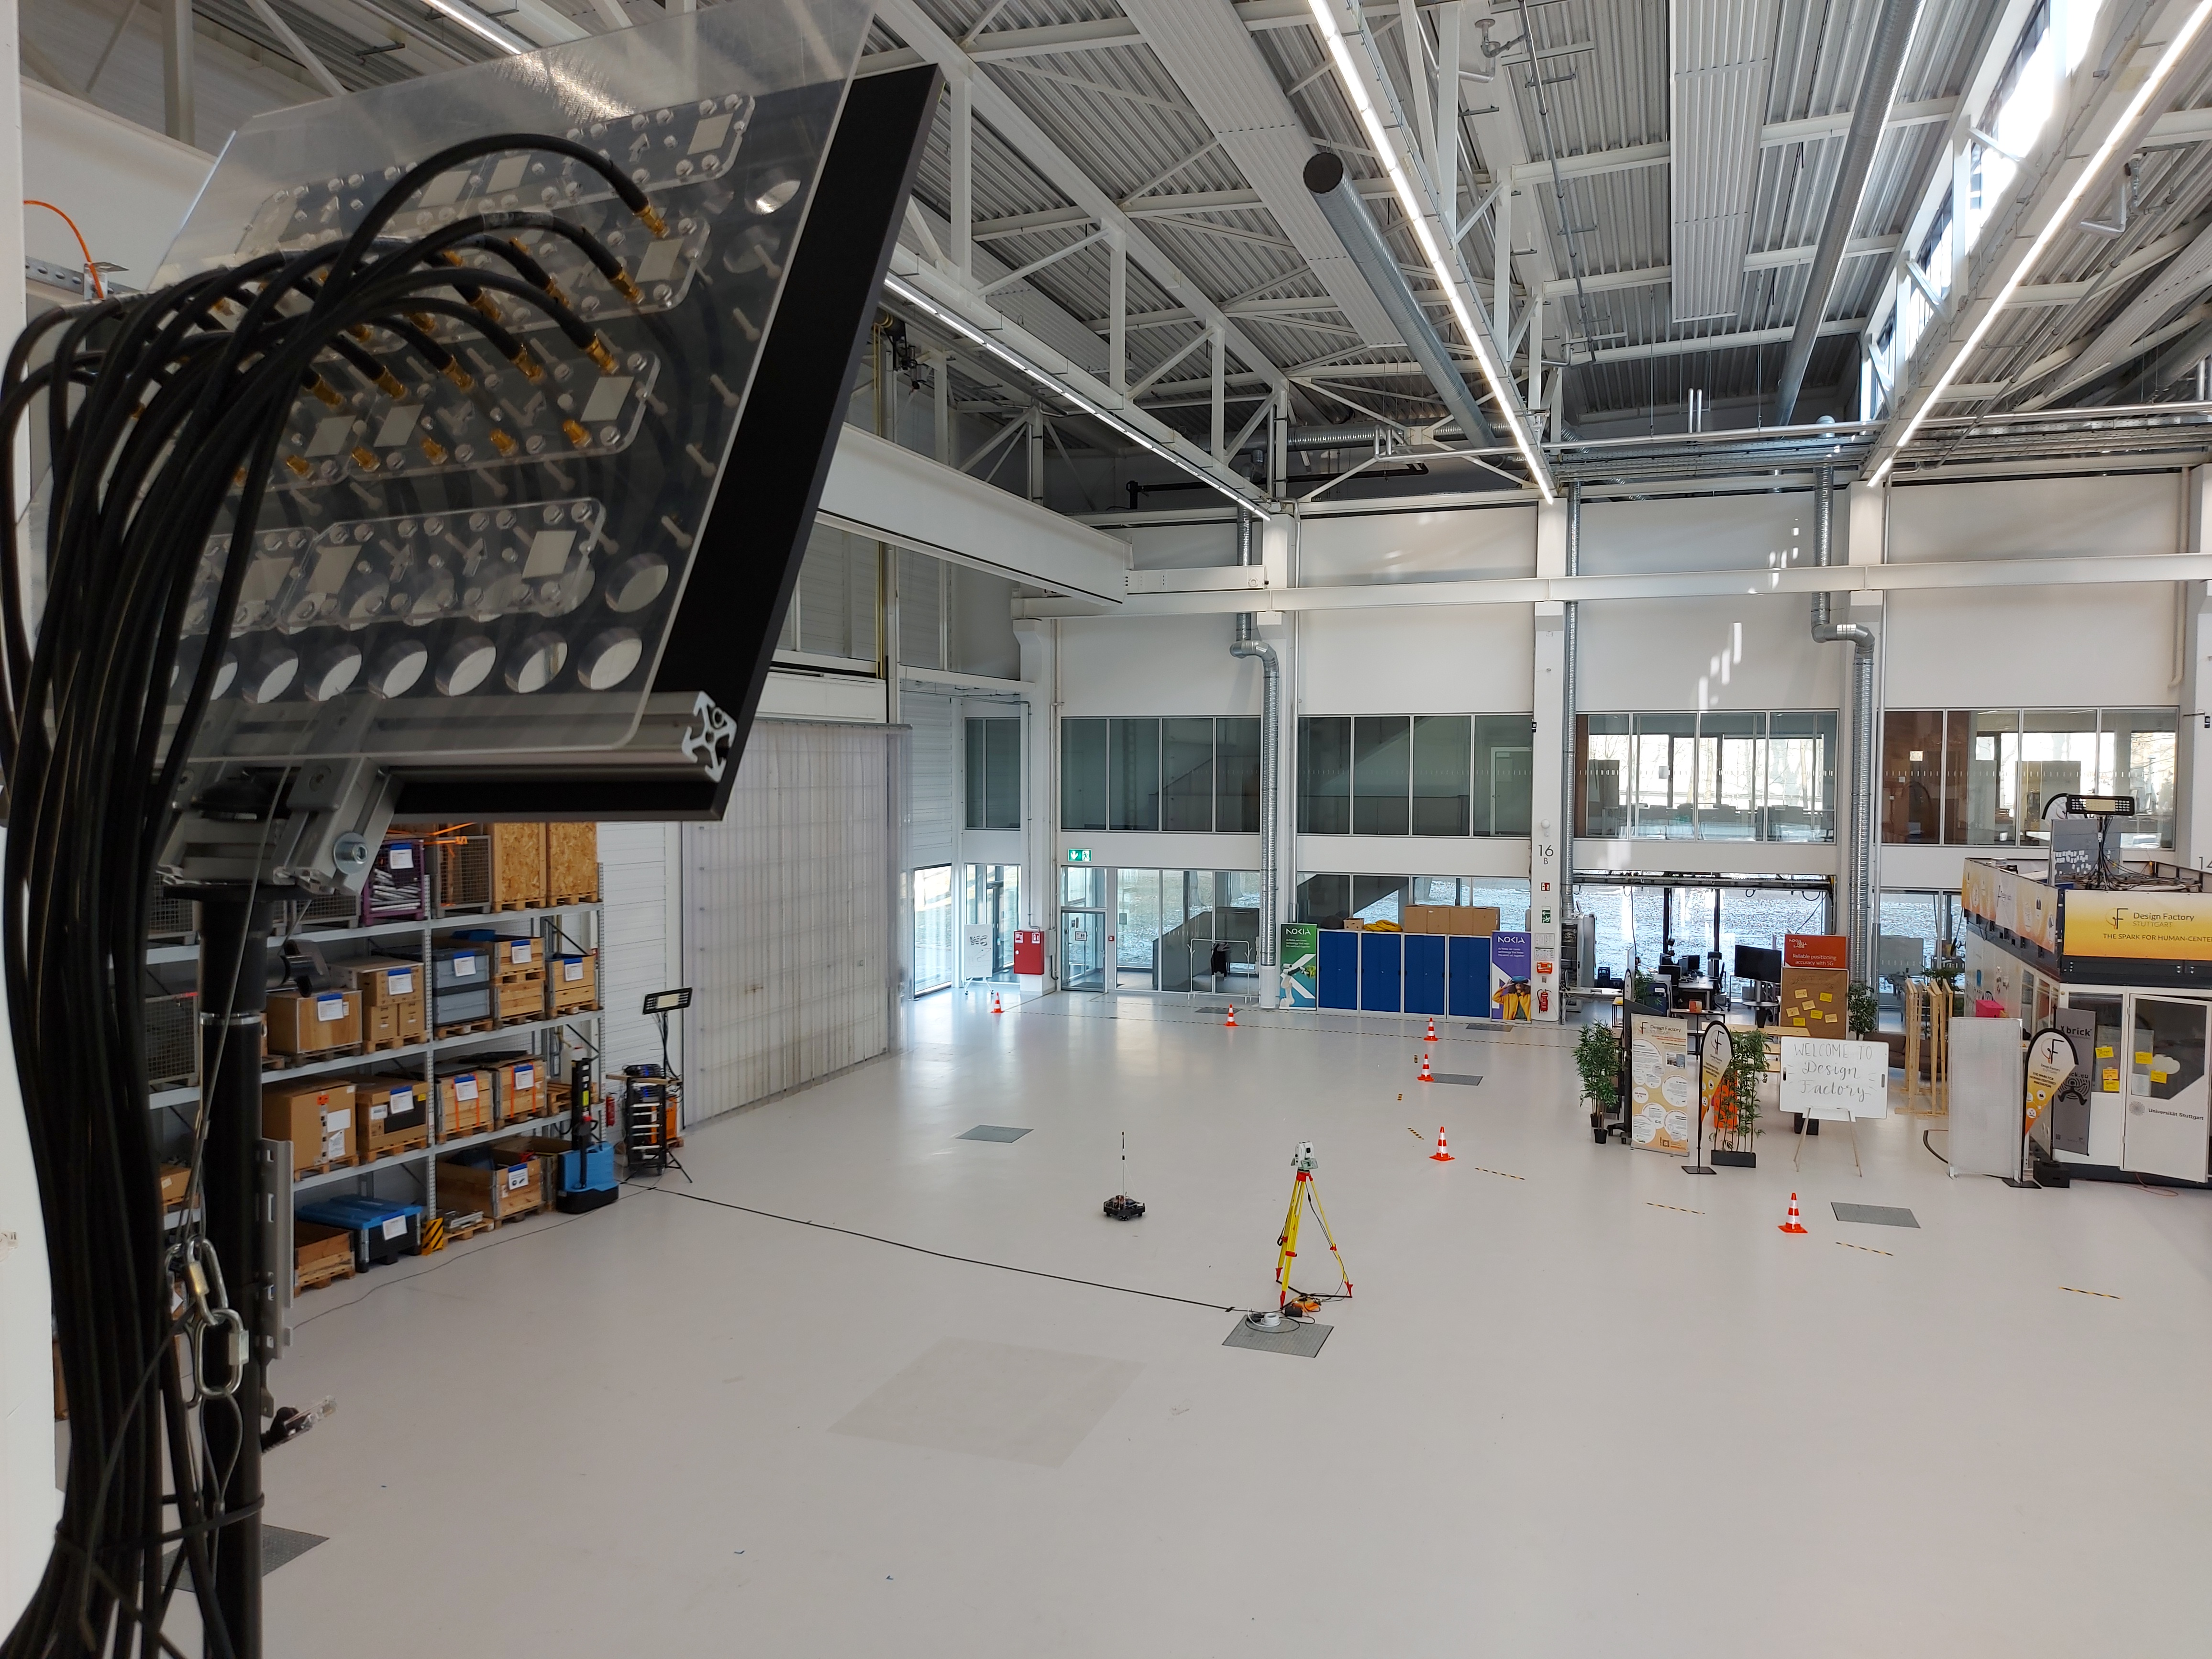
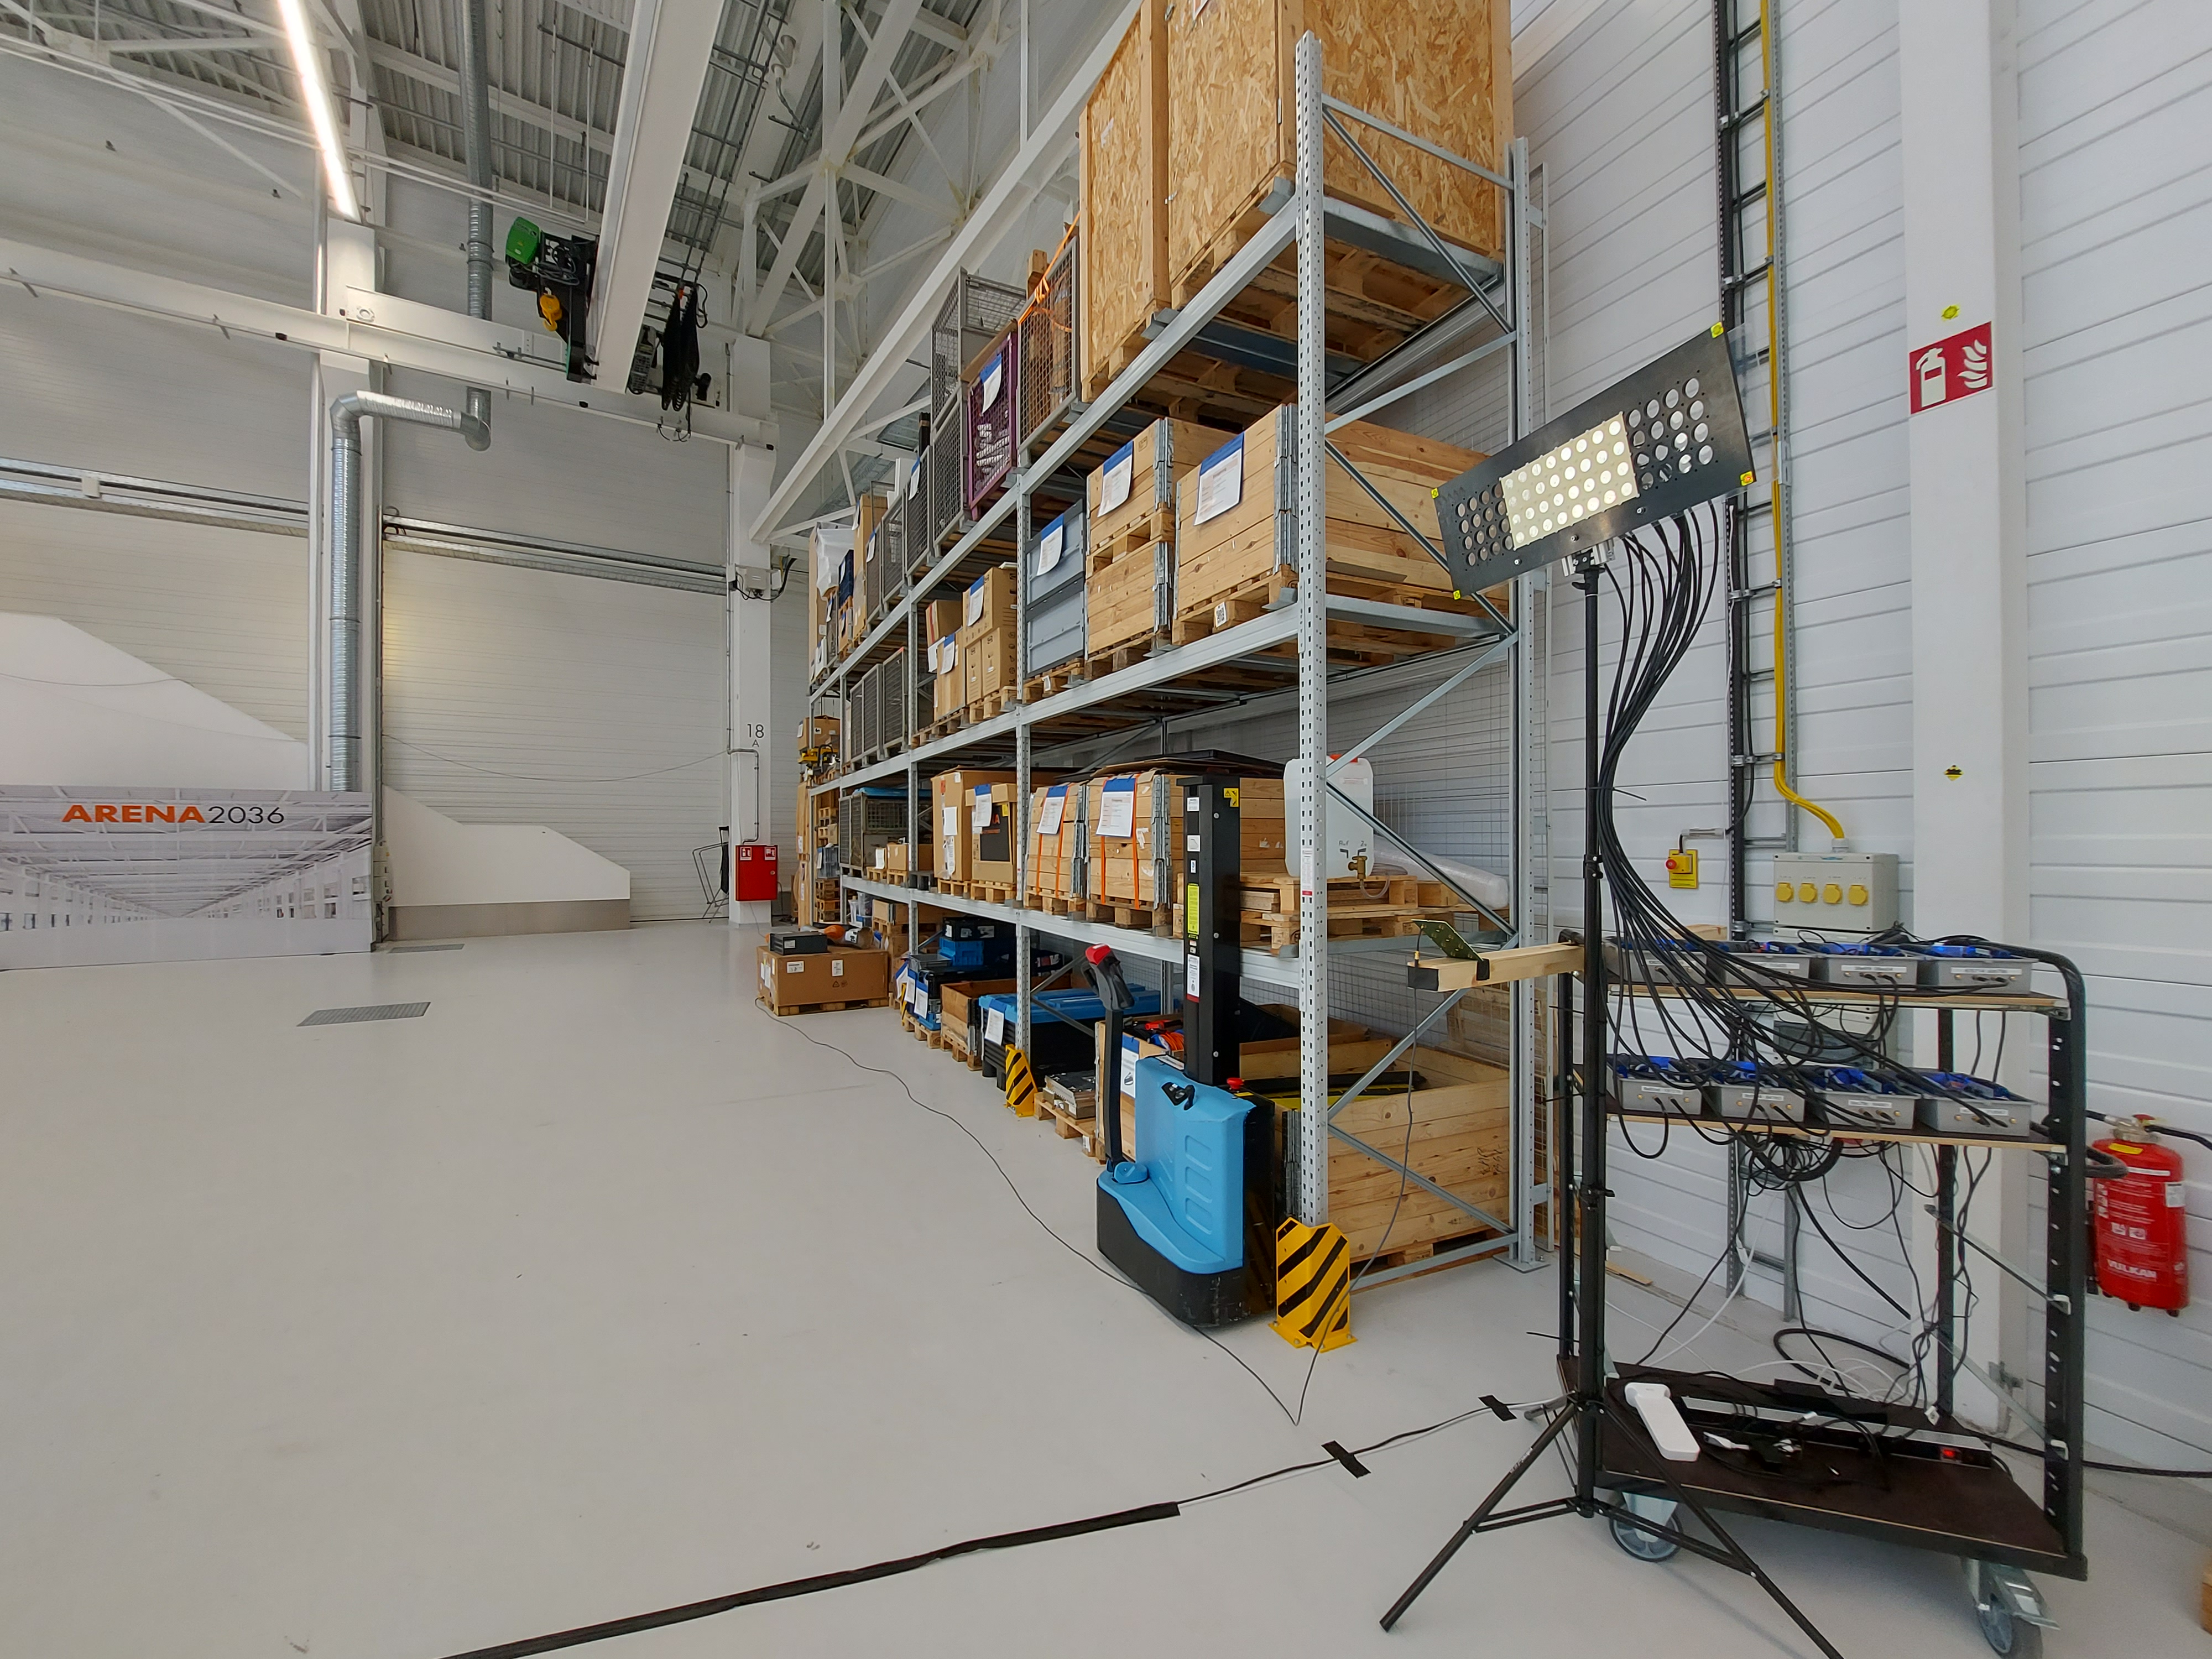
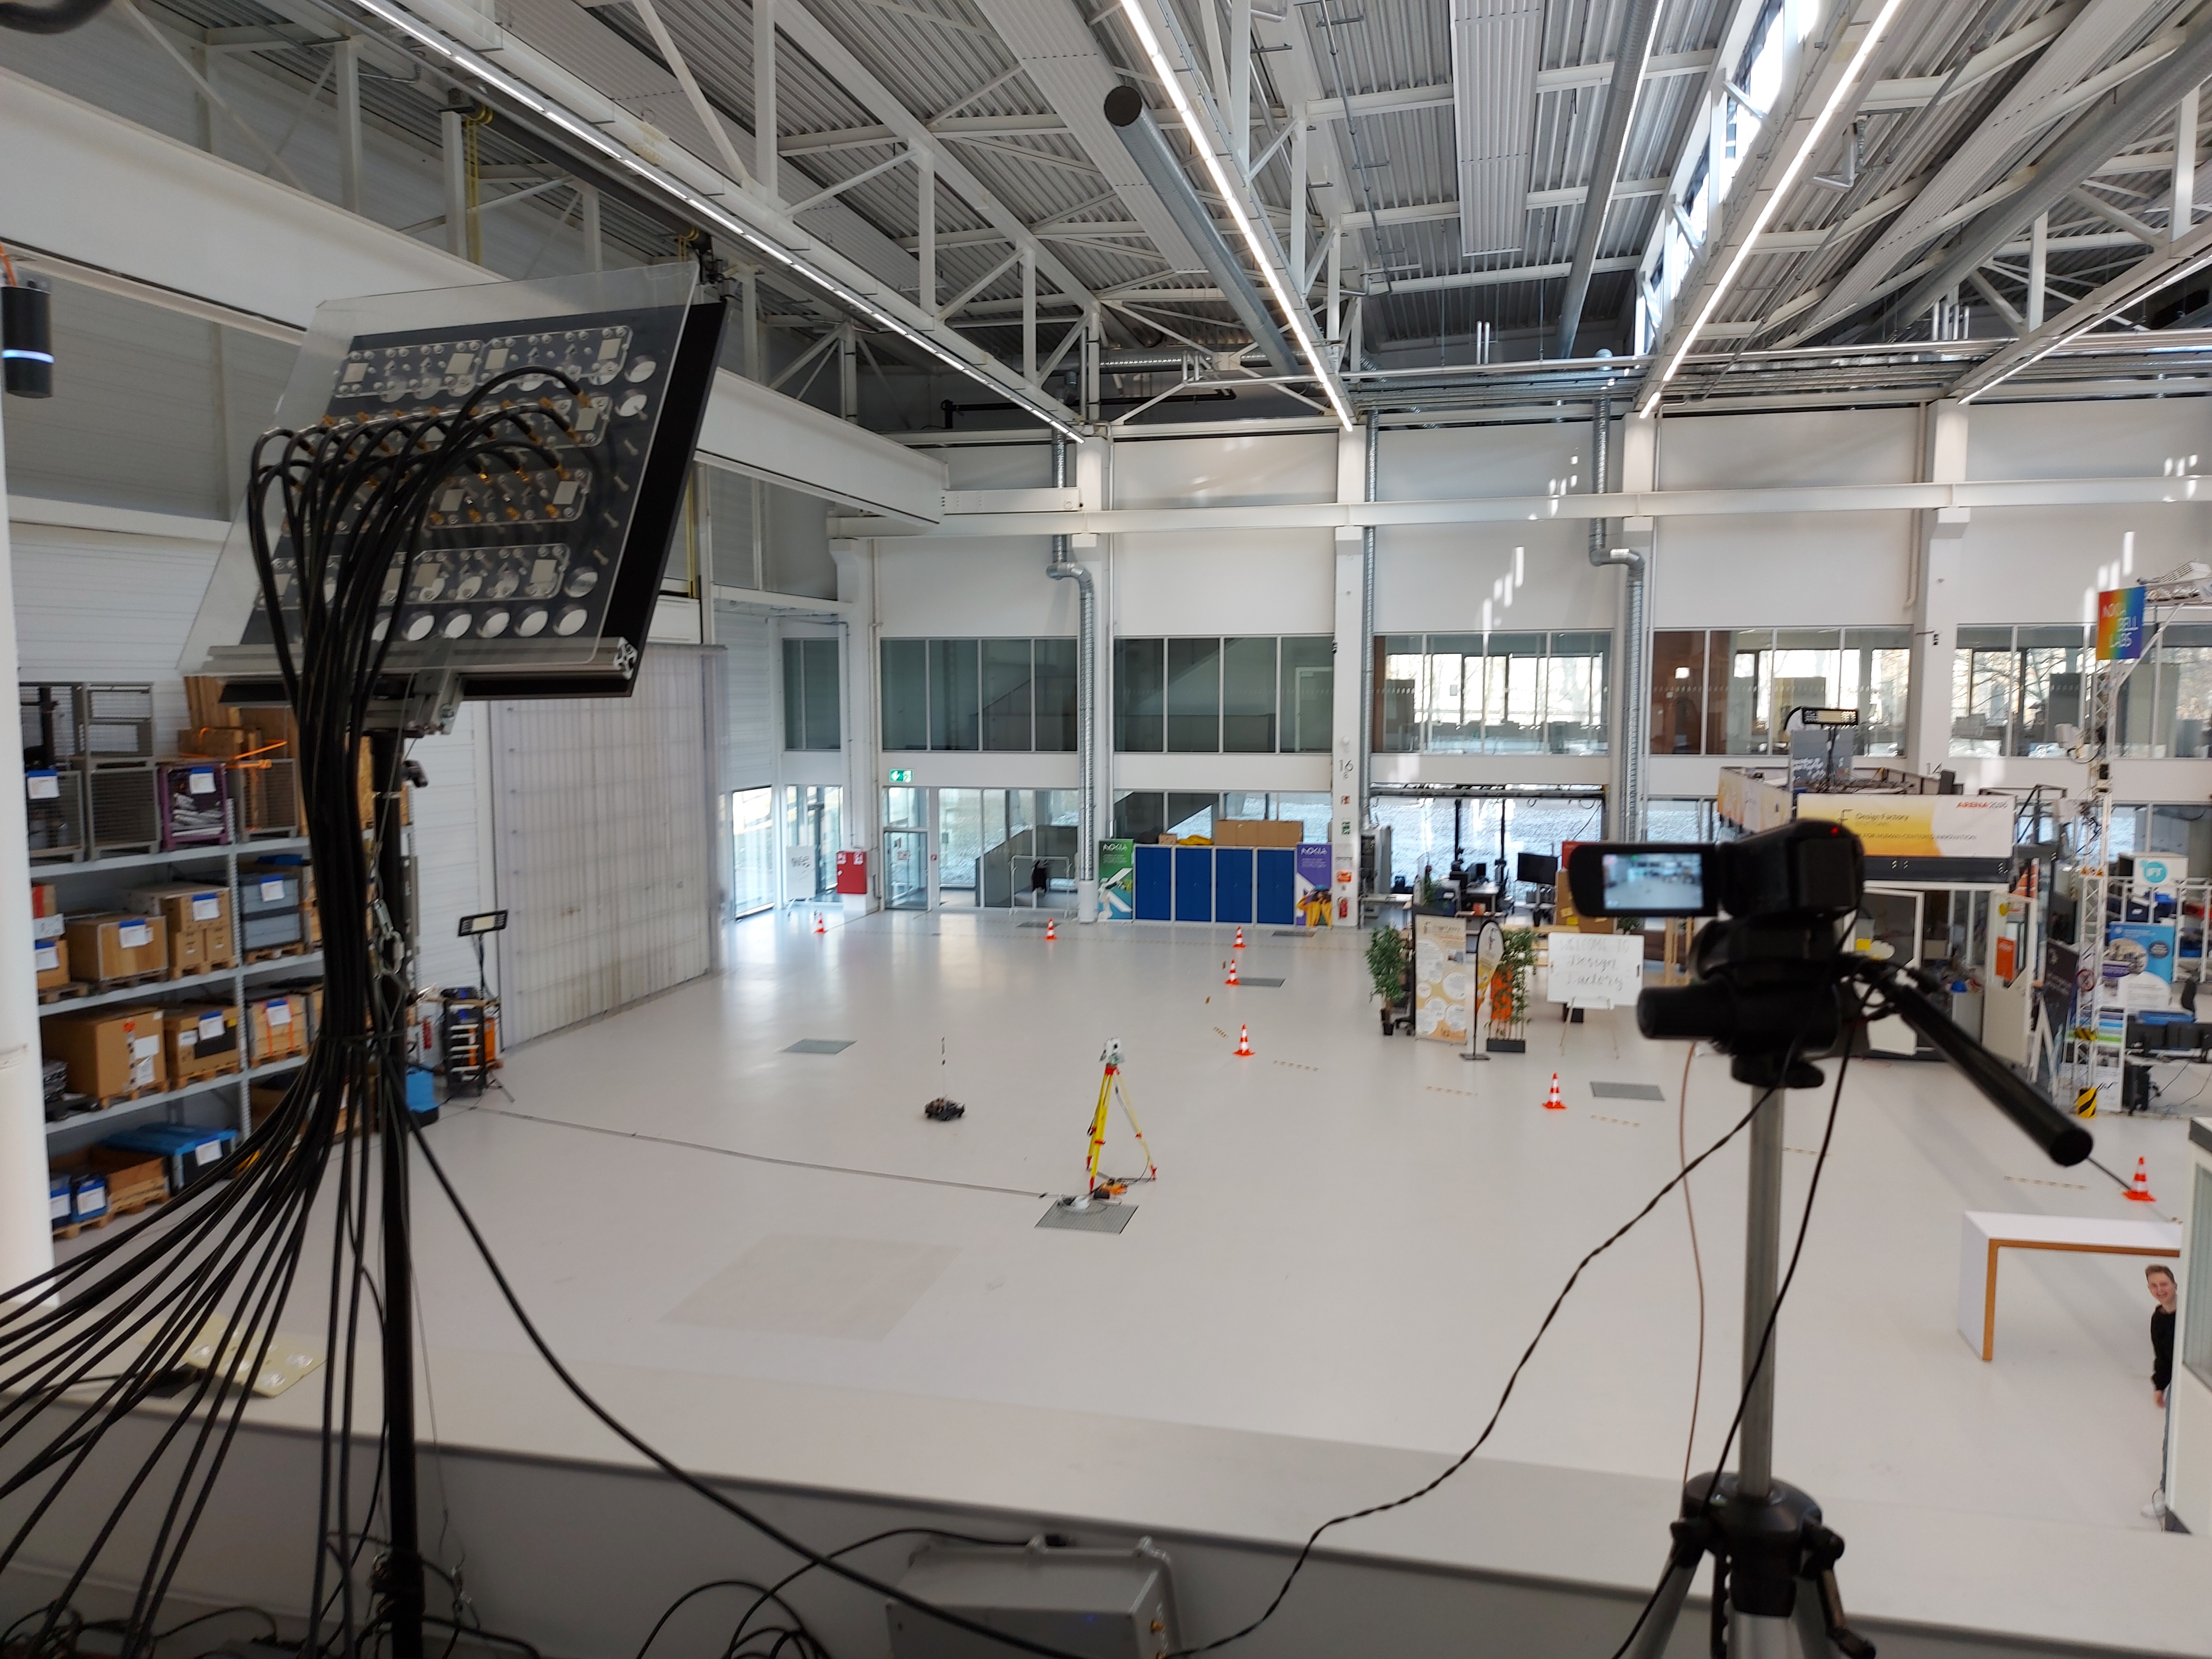
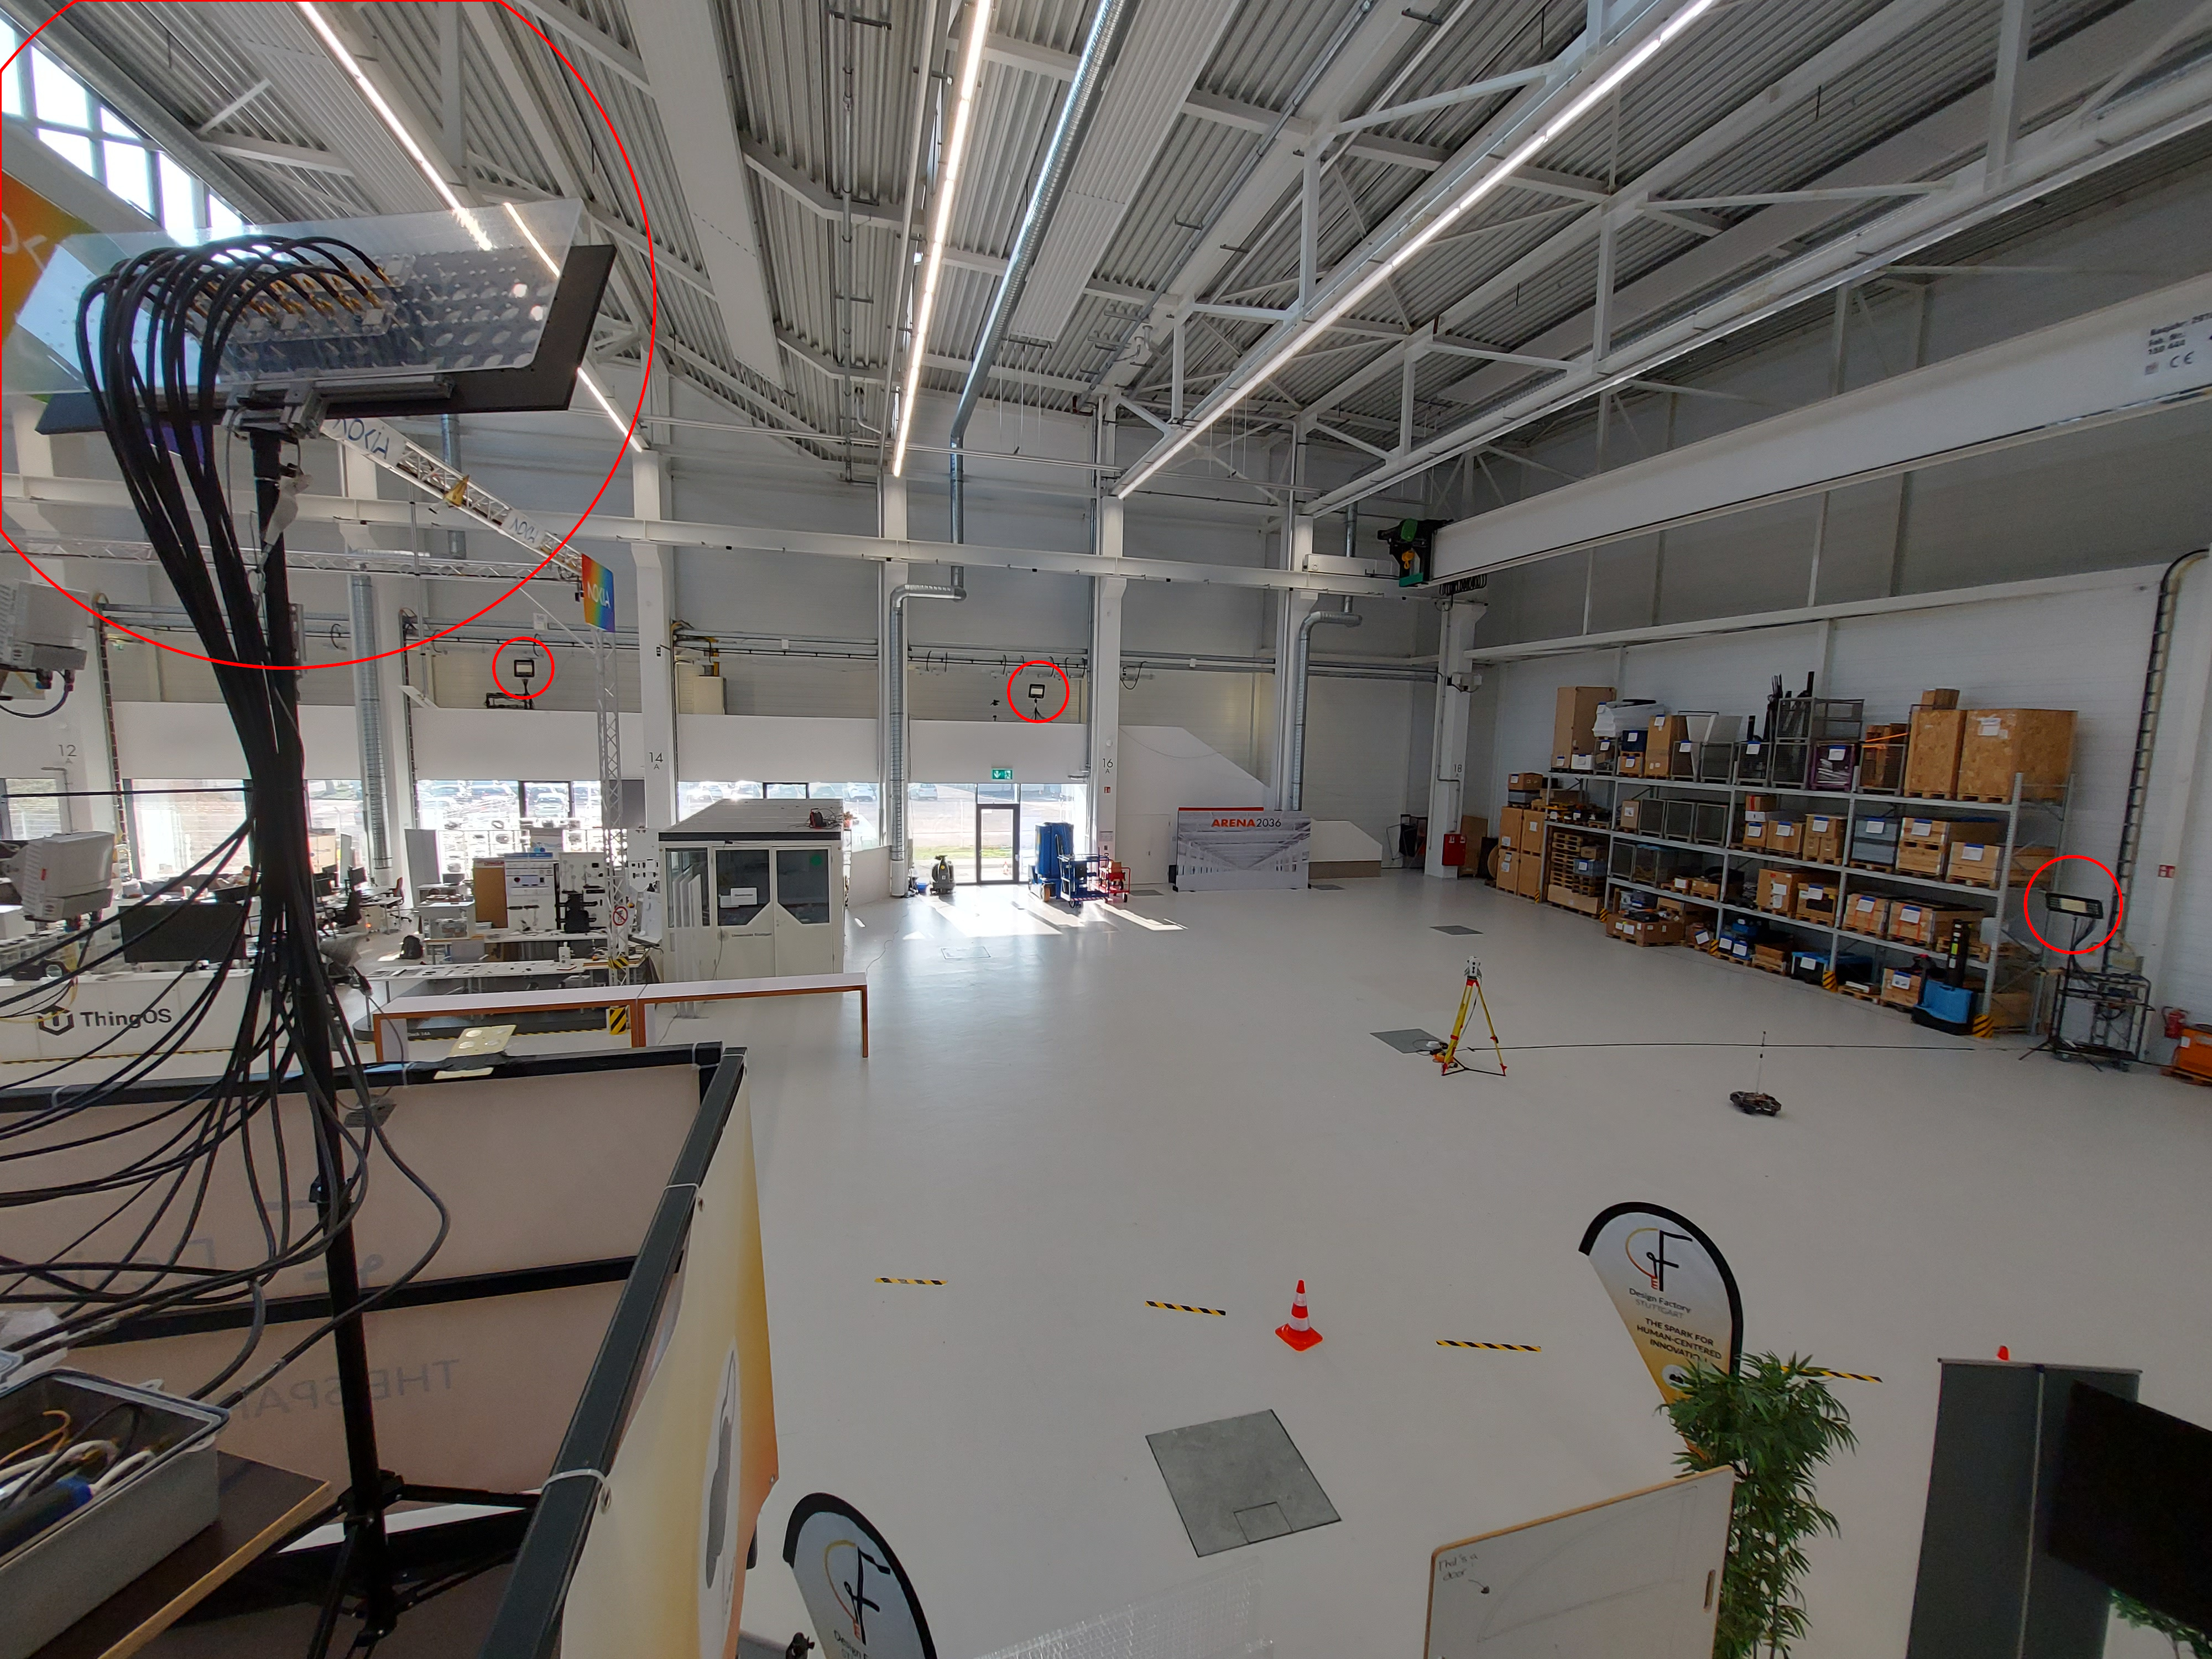
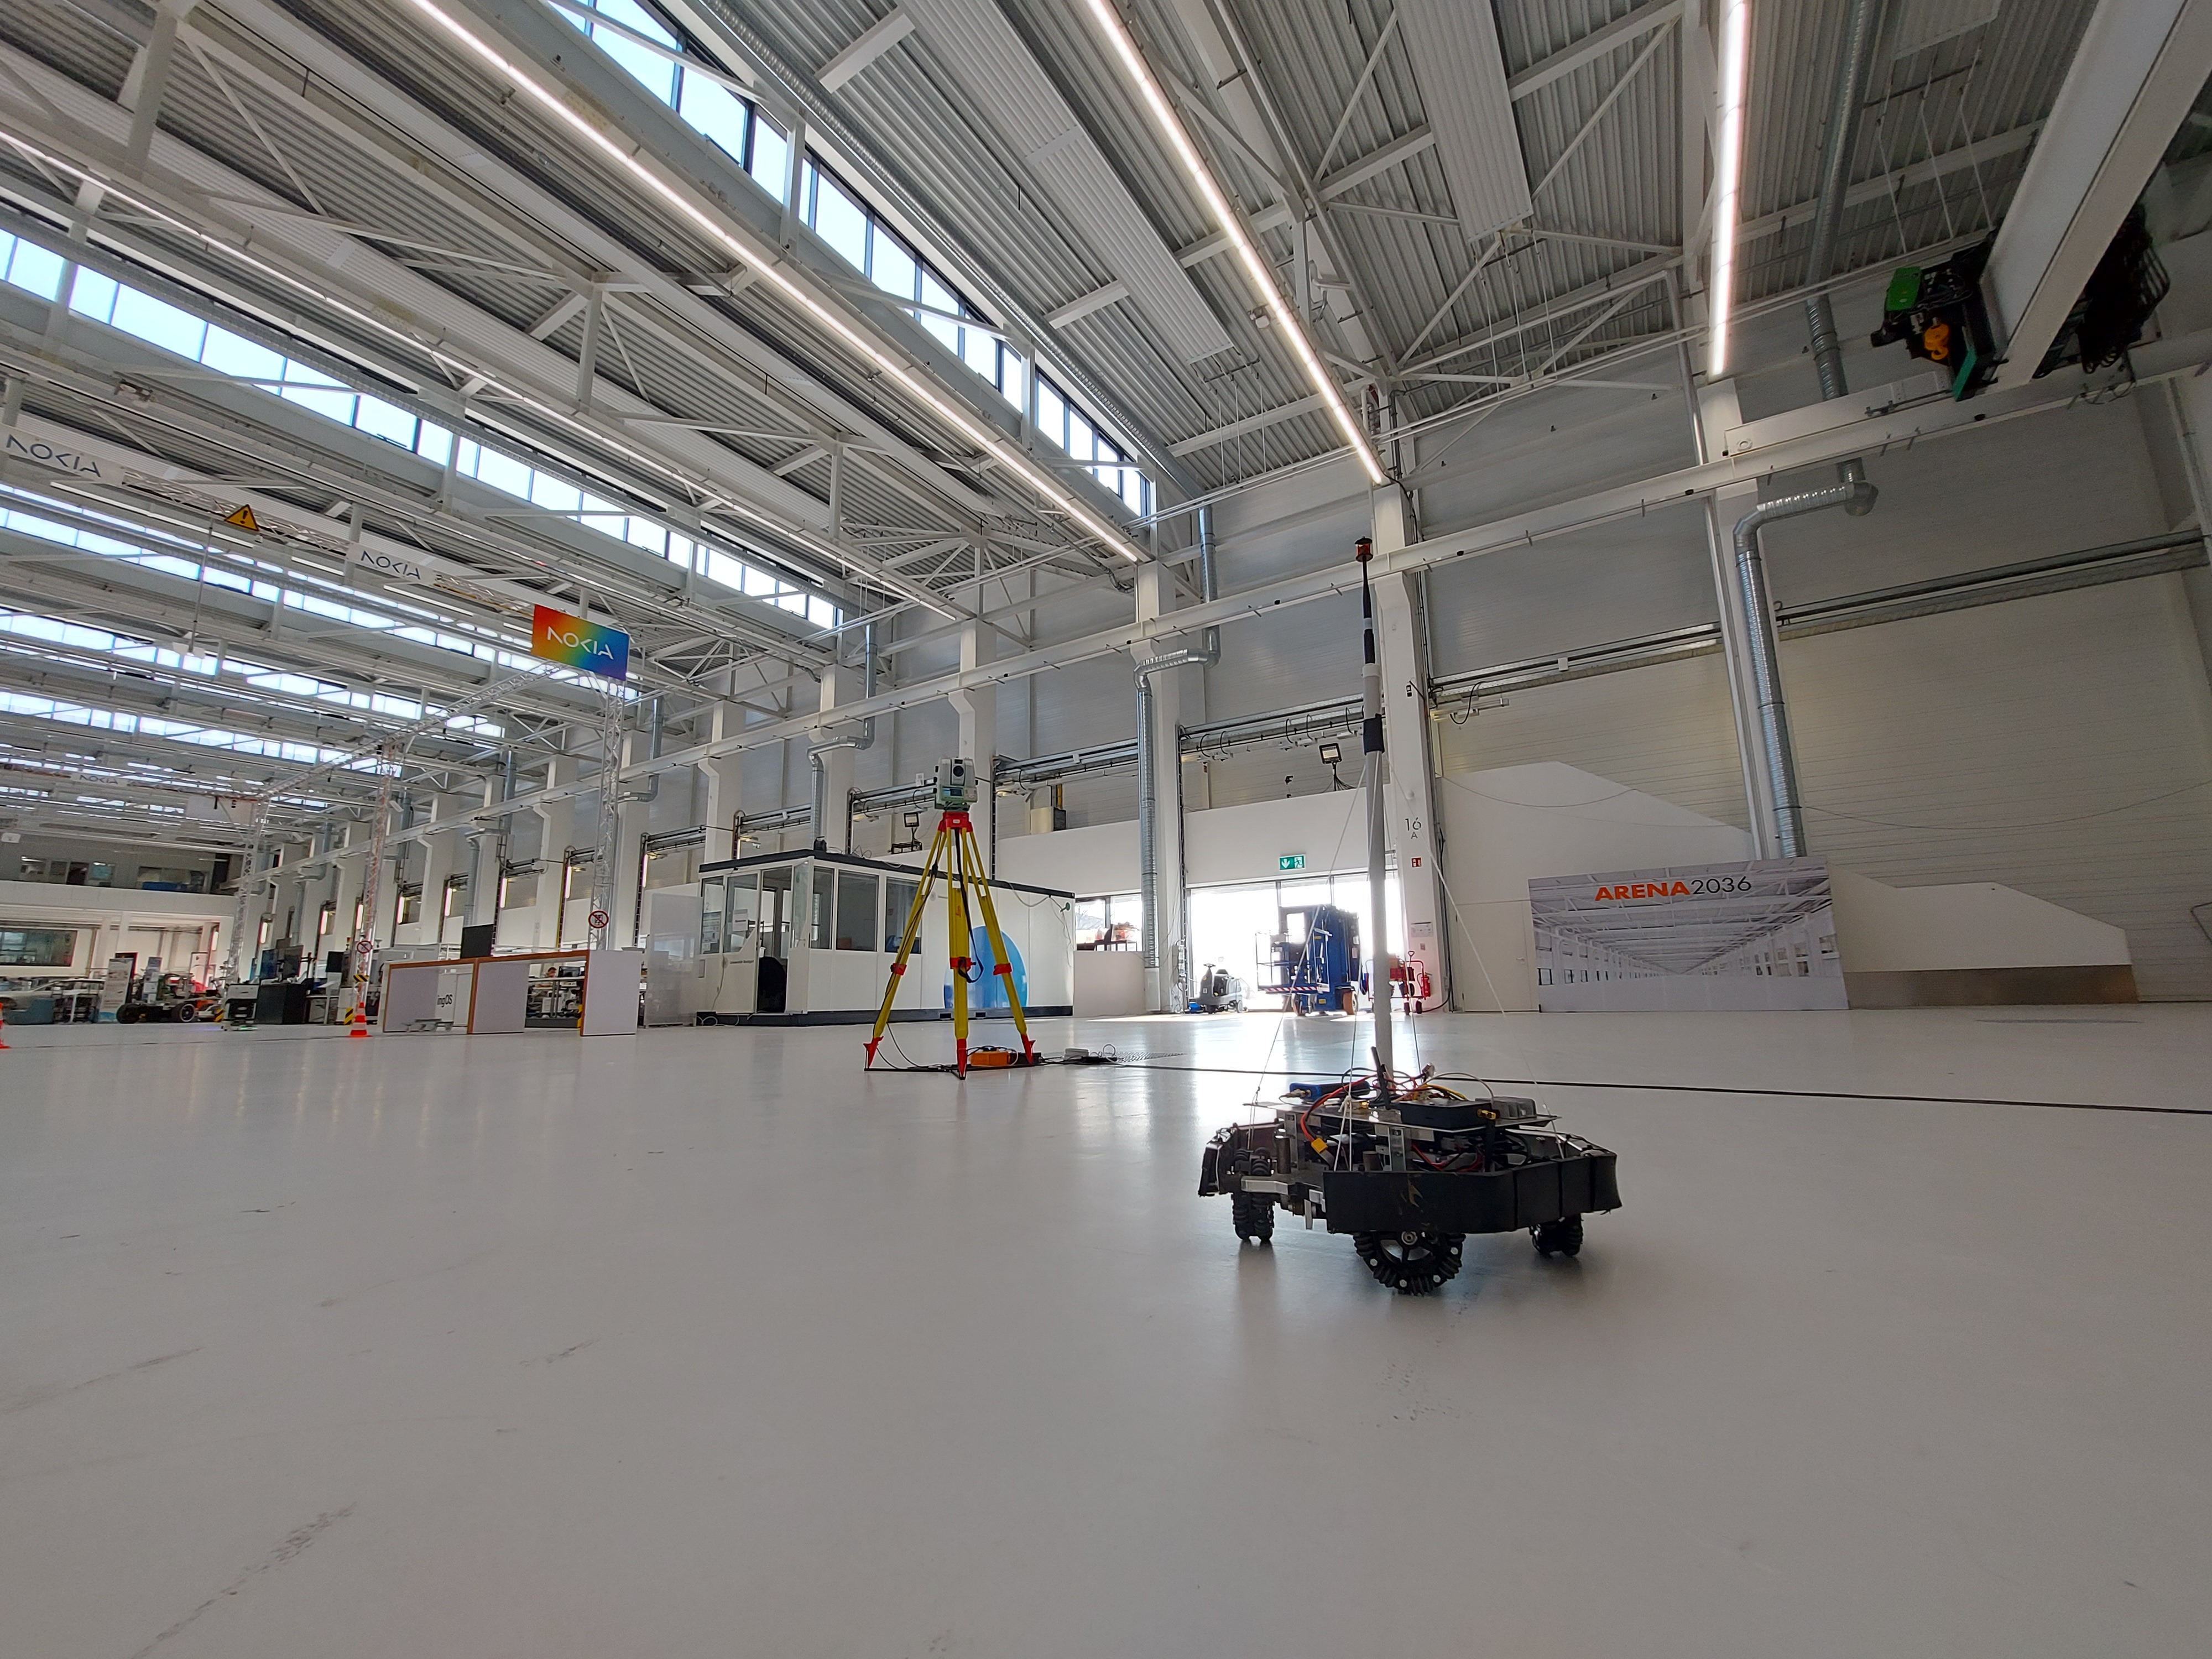
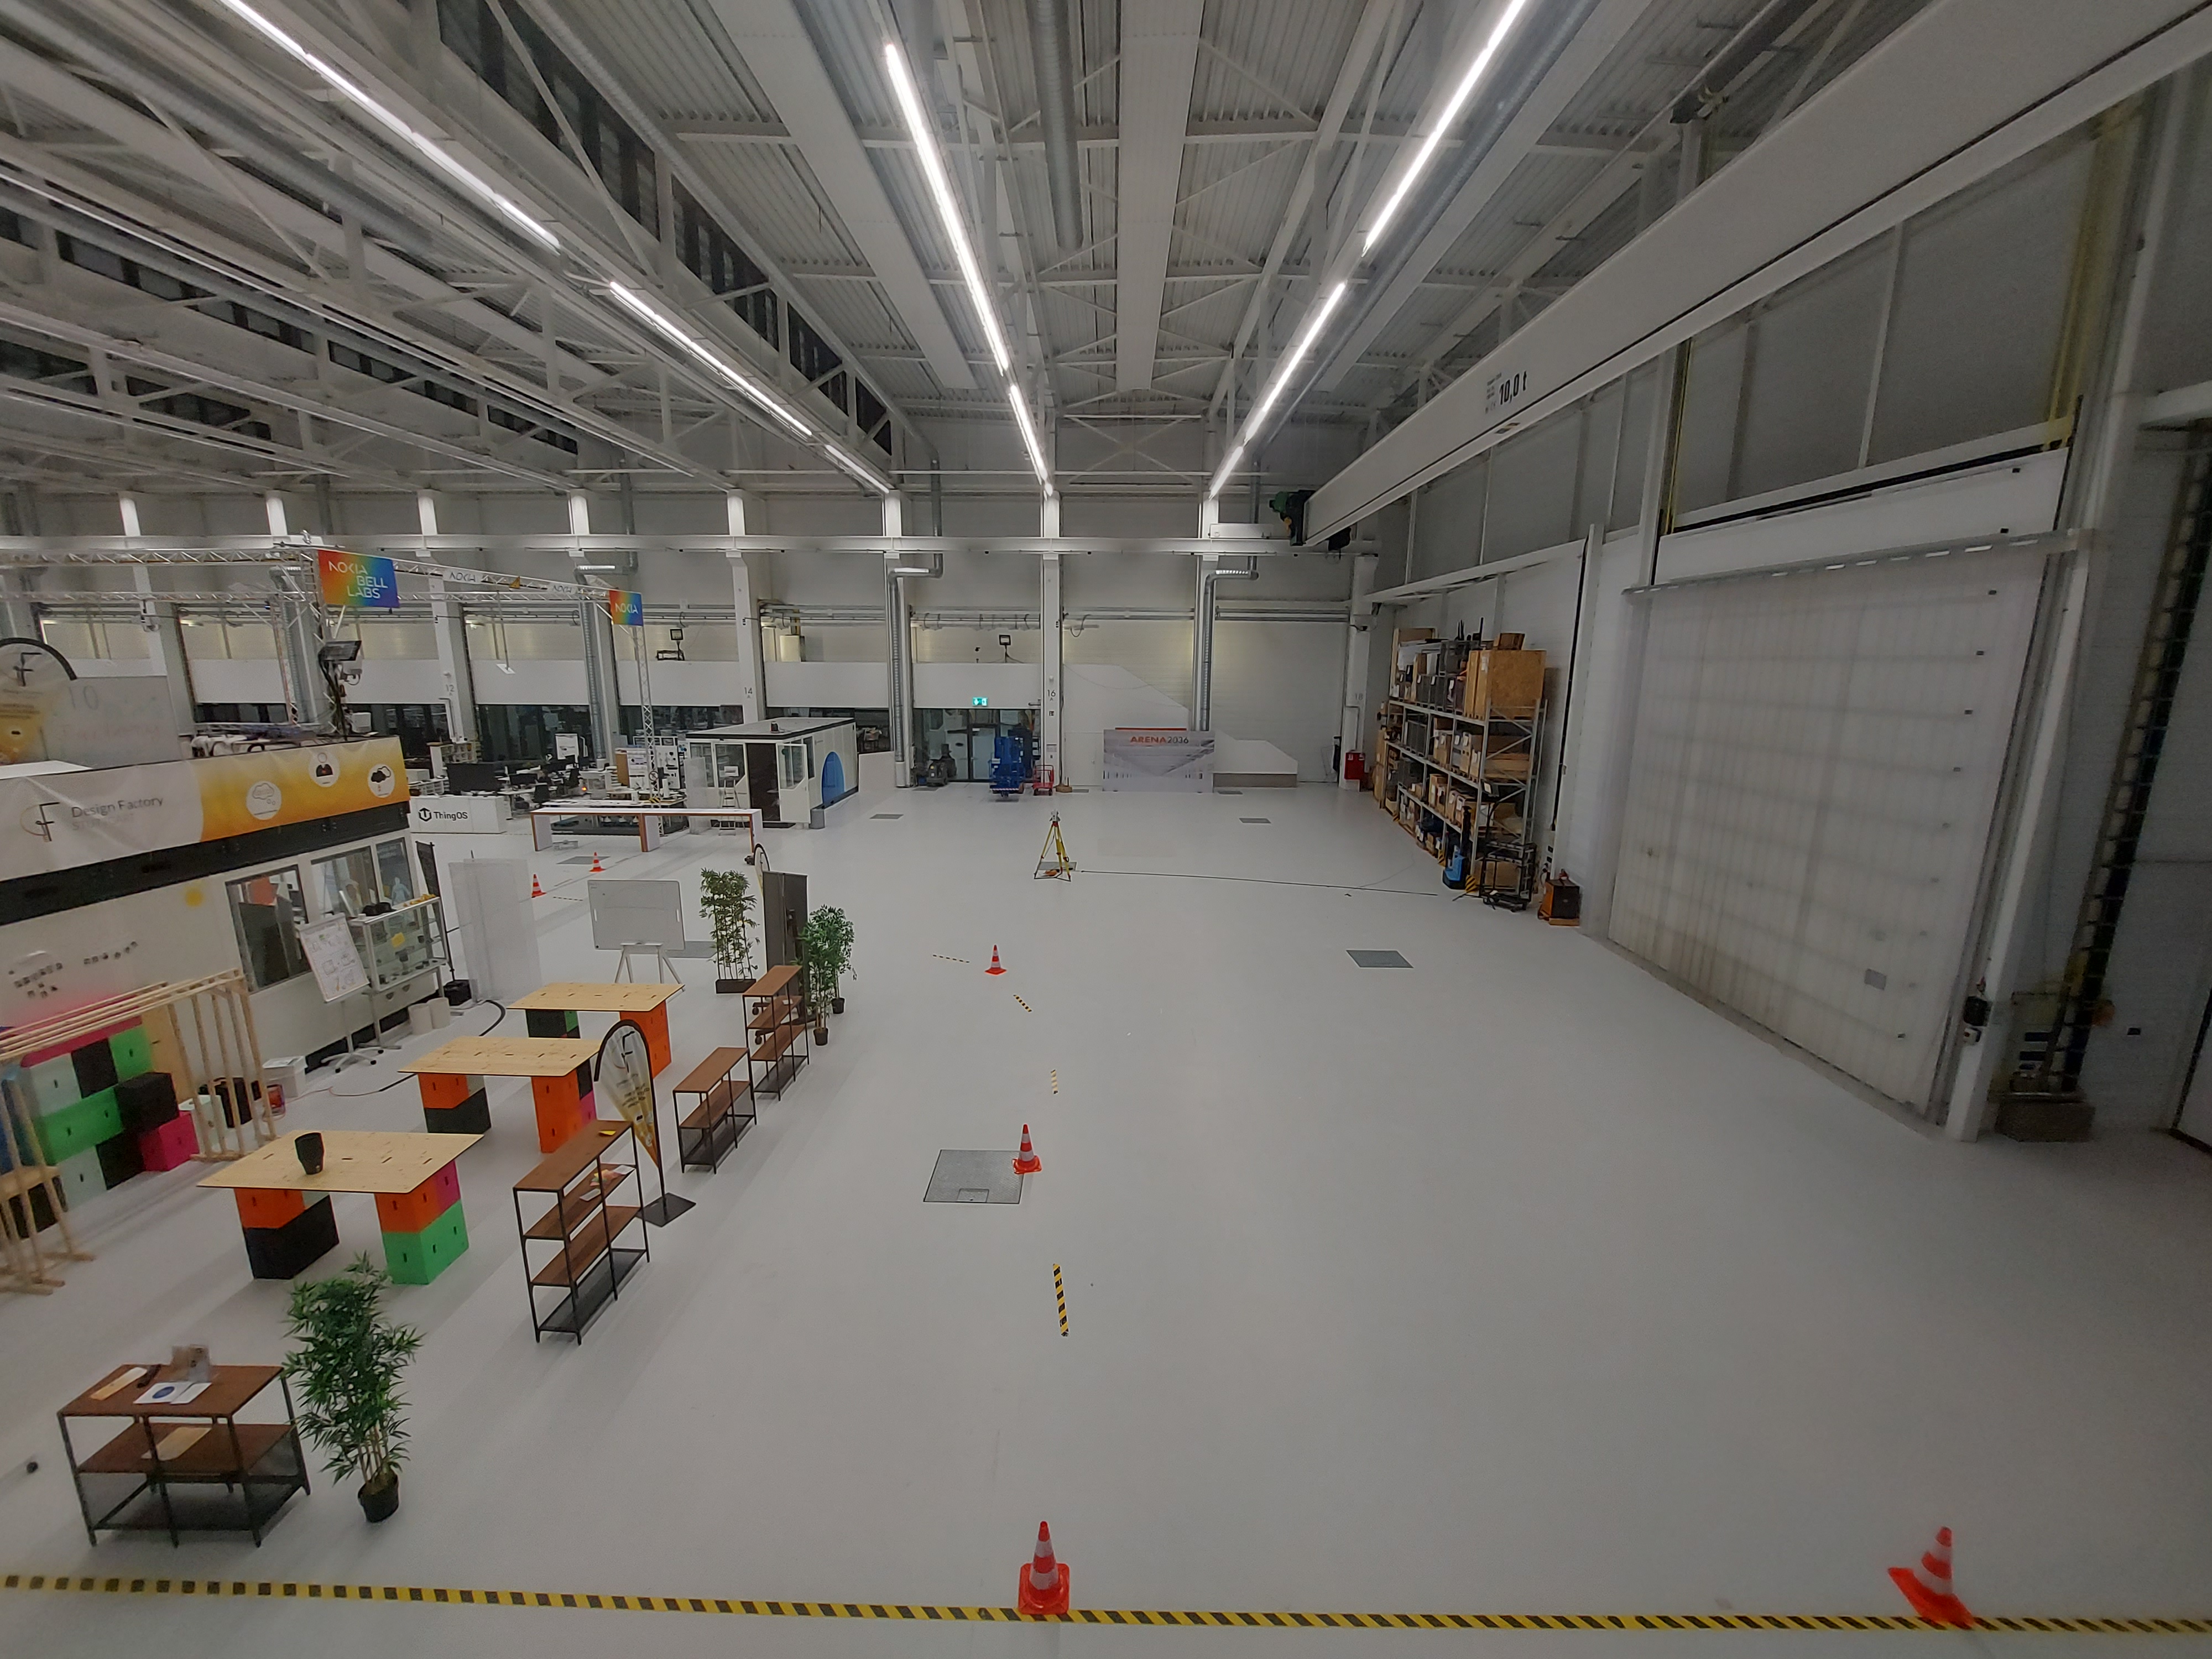
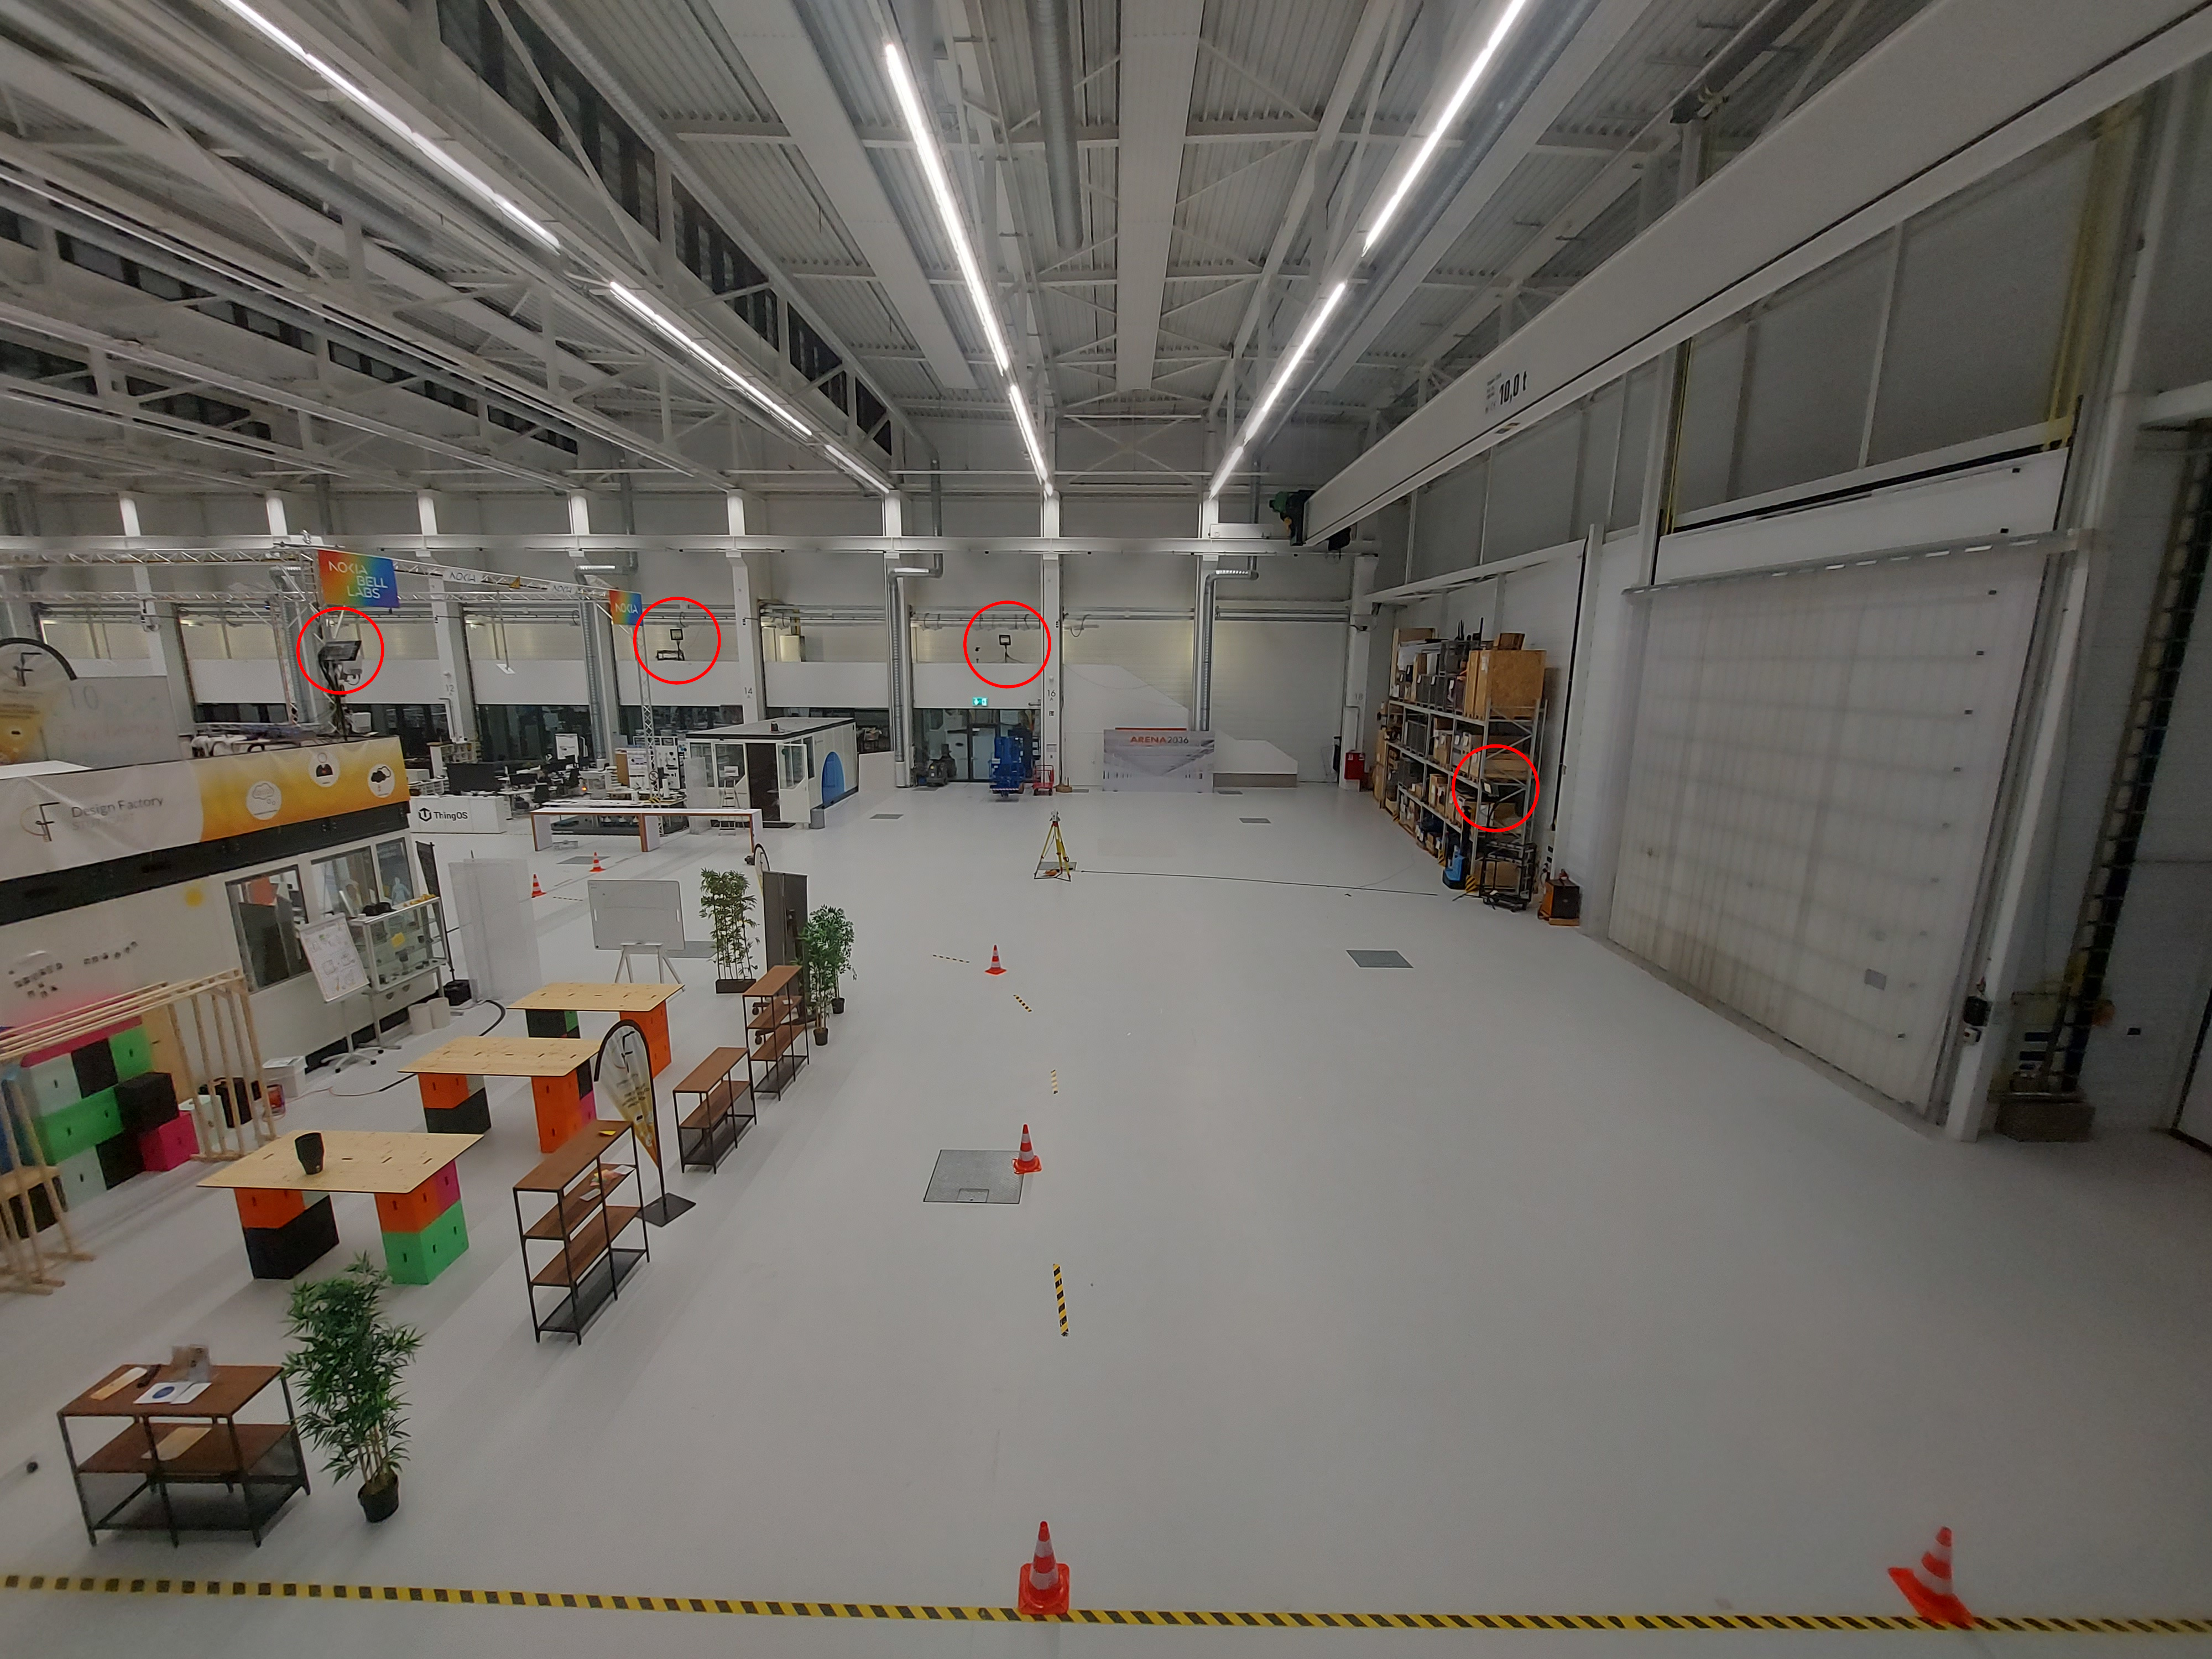
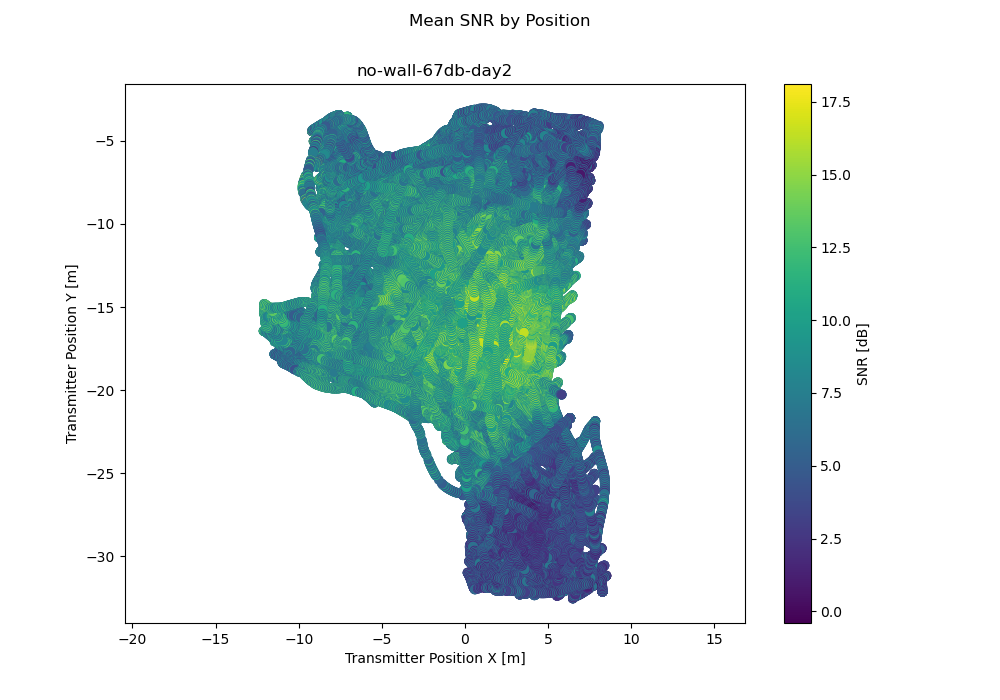
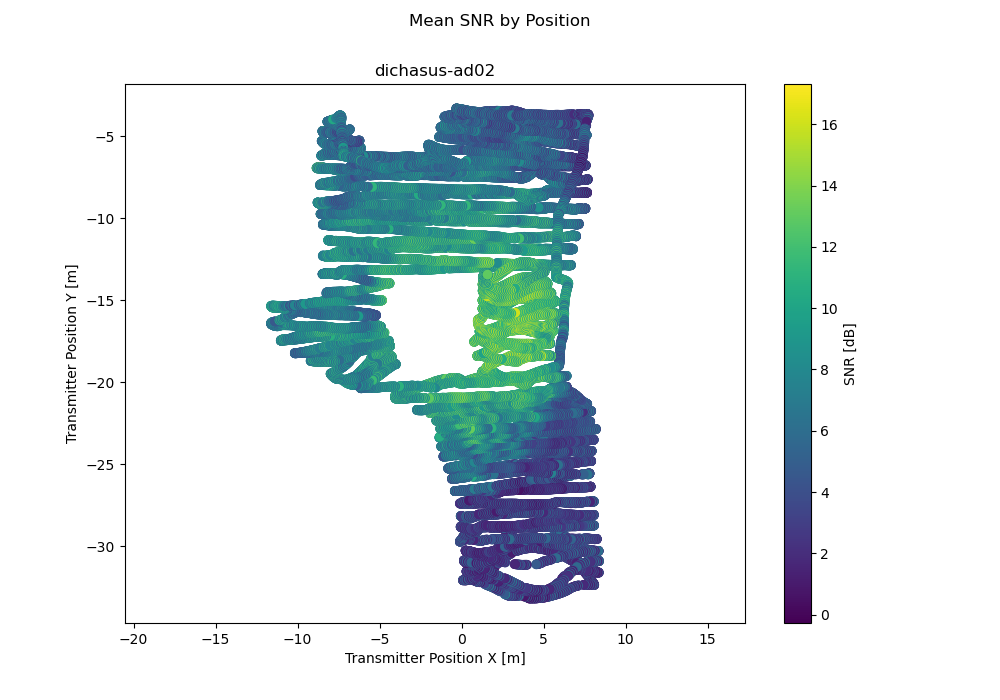
Channel measurements in the ARENA2036 research factory with known 3D pointcloud scan and video of environment. 64 antennas, arranged into four arrays.
50.056 MHz
Signal Bandwidth
1024
OFDM Subcarriers
411506
Data Points
22683.0 s
Total Duration
216.0 GB
Total Download Size
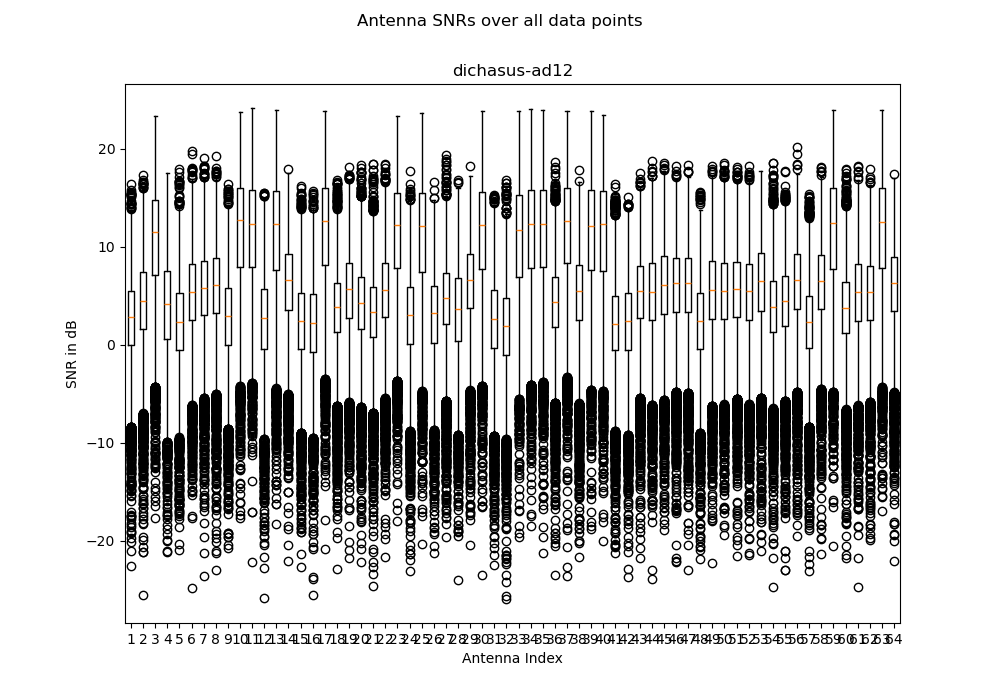
64
Number of Antennas
Indoor
Type of Environment
3.440000 GHz
Carrier Frequency
Distributed
Antenna Setup
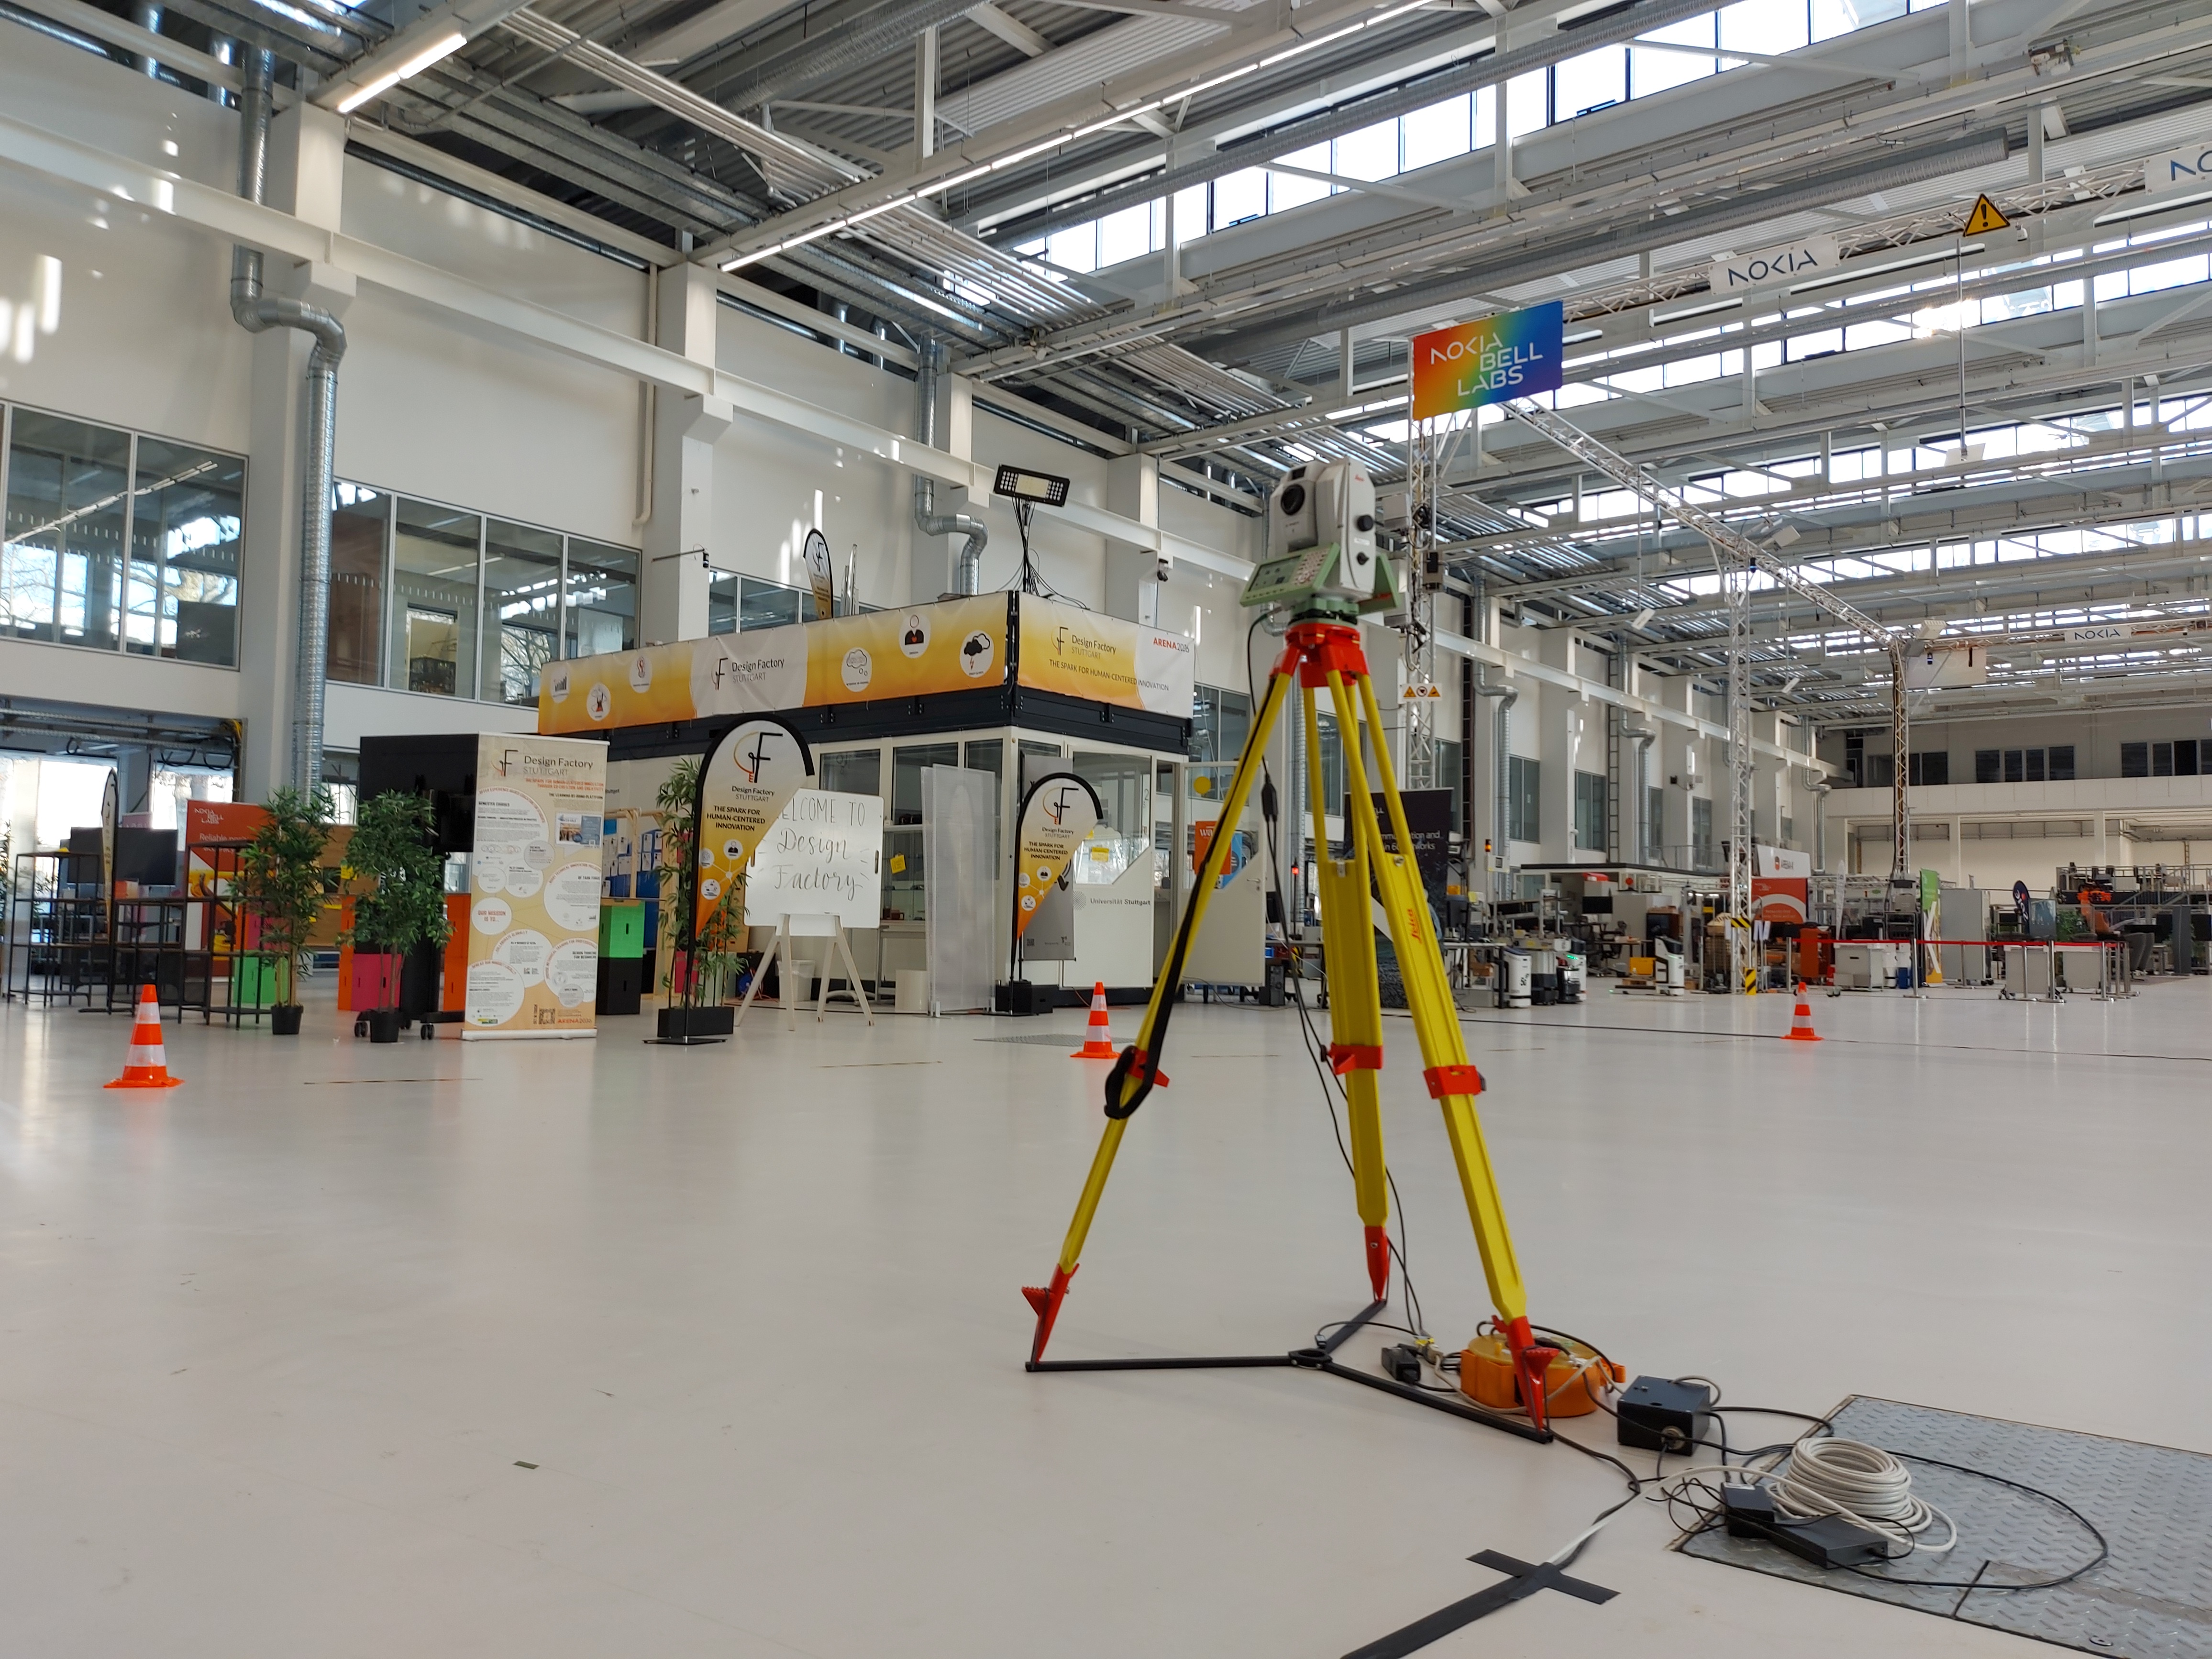
3D Tachymeter
Position-Tagged
48.000 ms
Measurement Interval
Experiment Setup

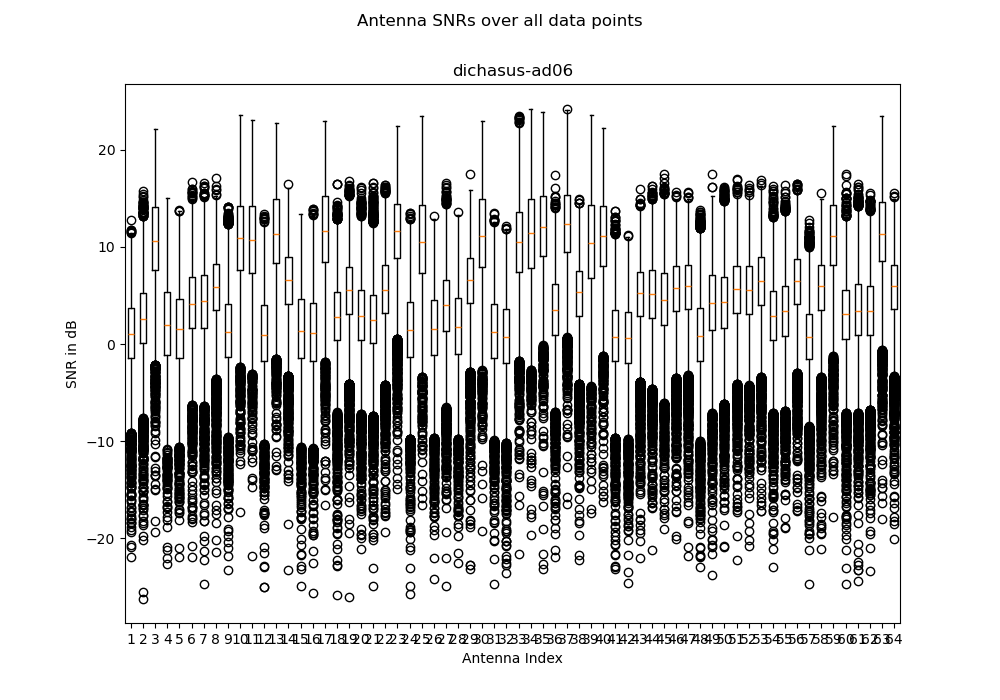
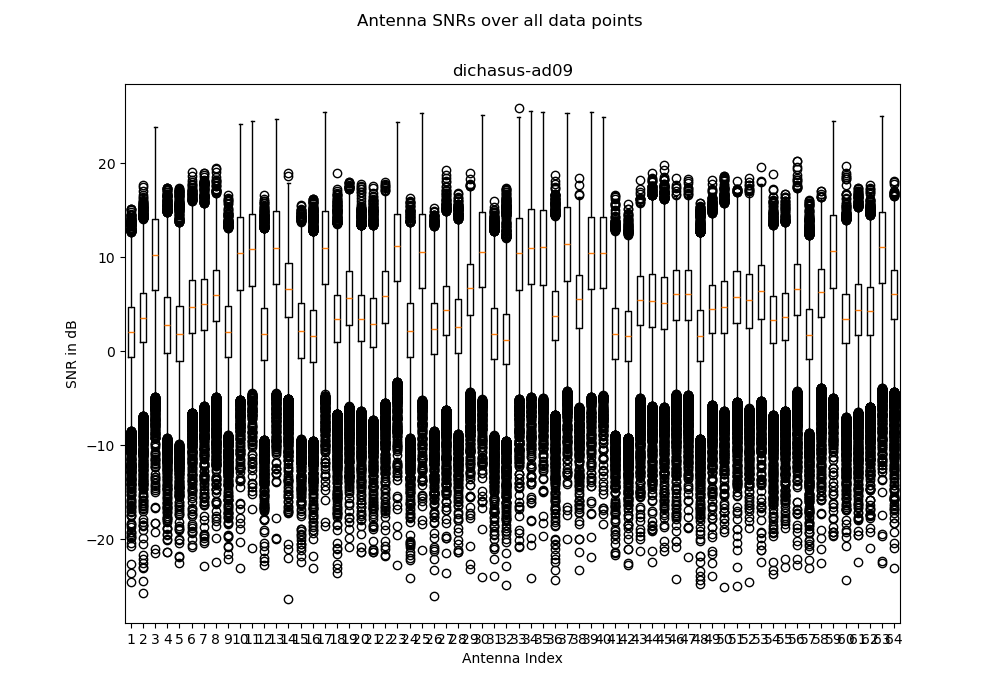
Data Analysis
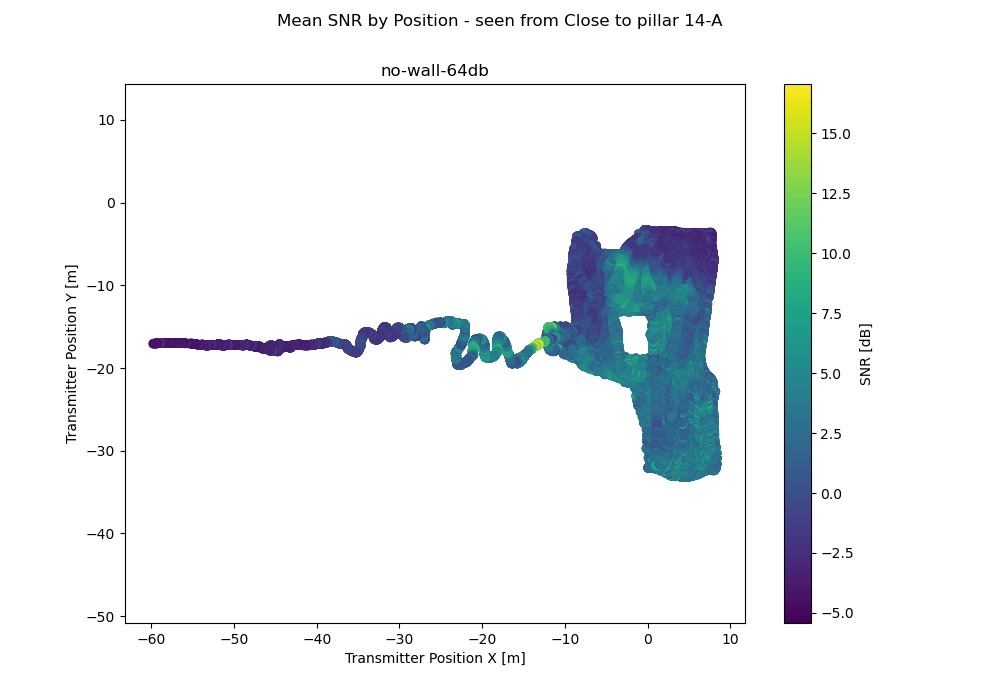
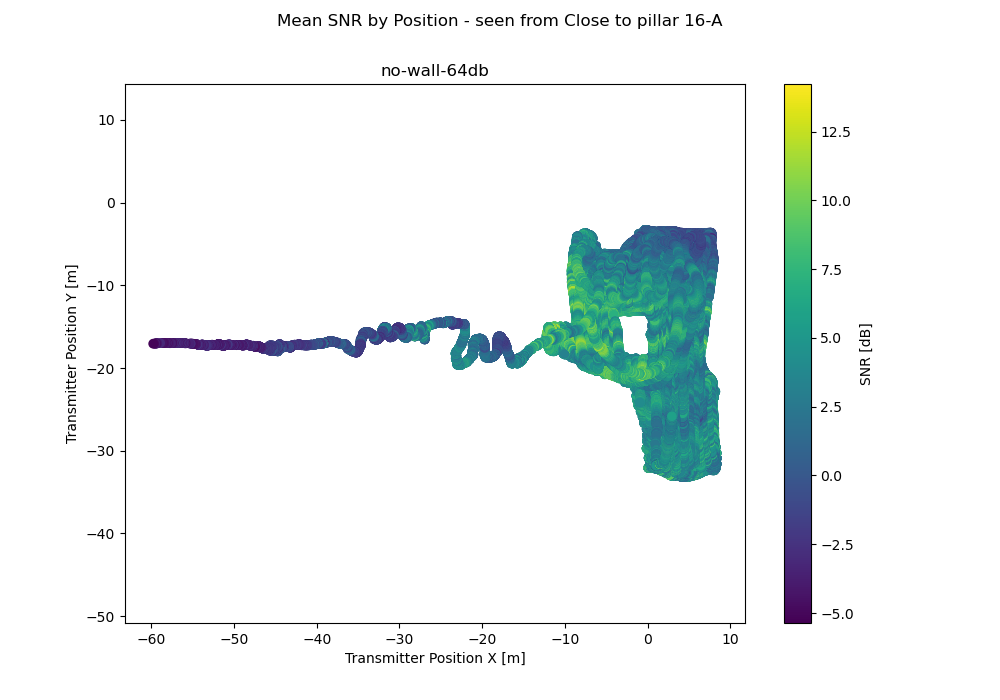
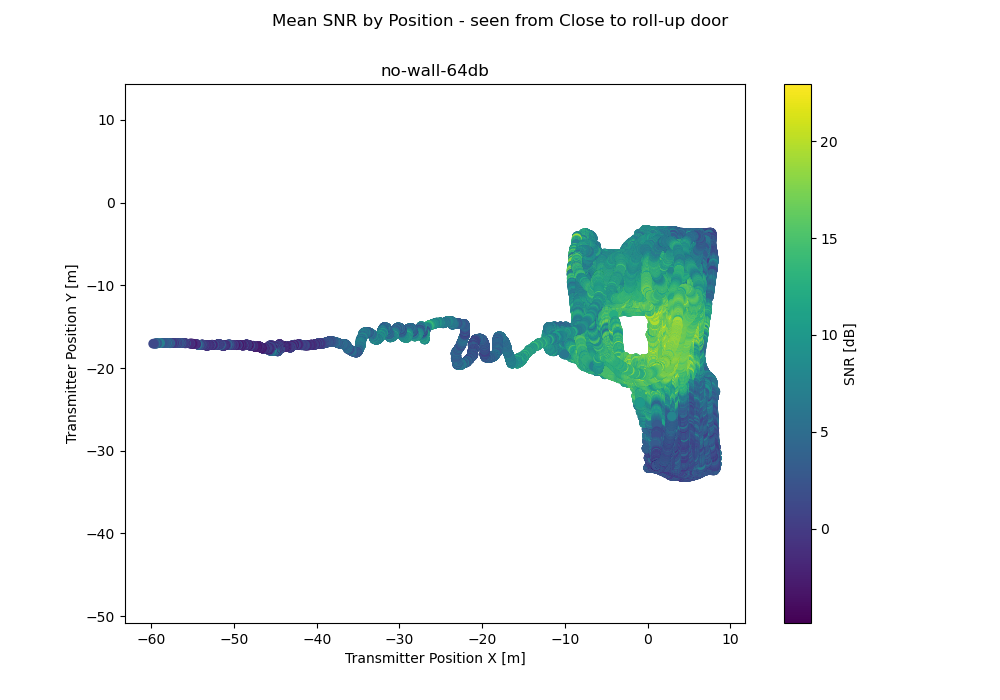
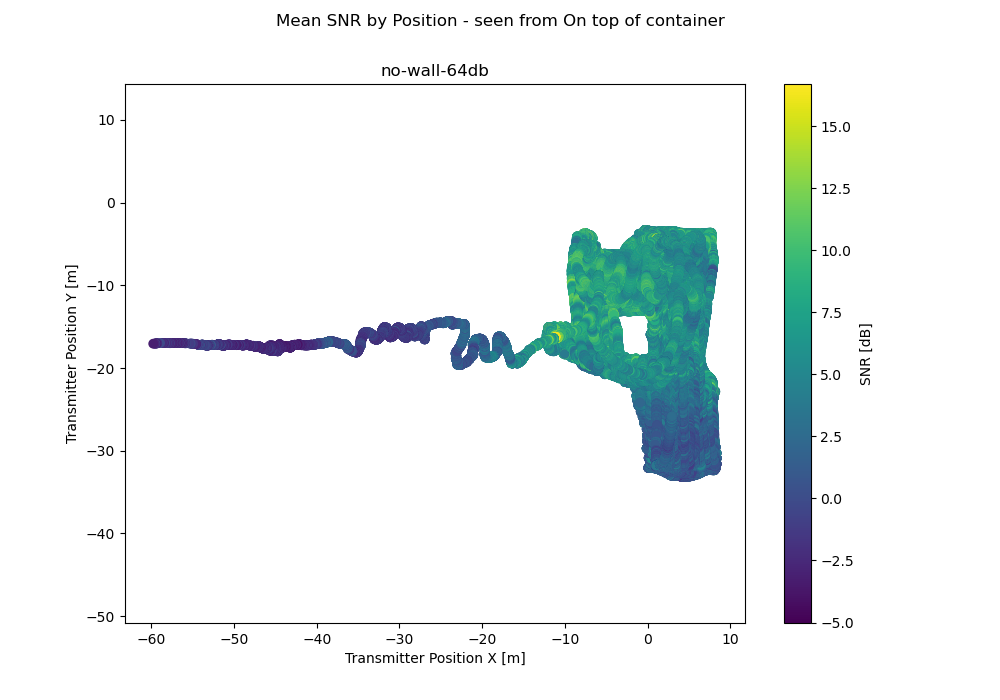
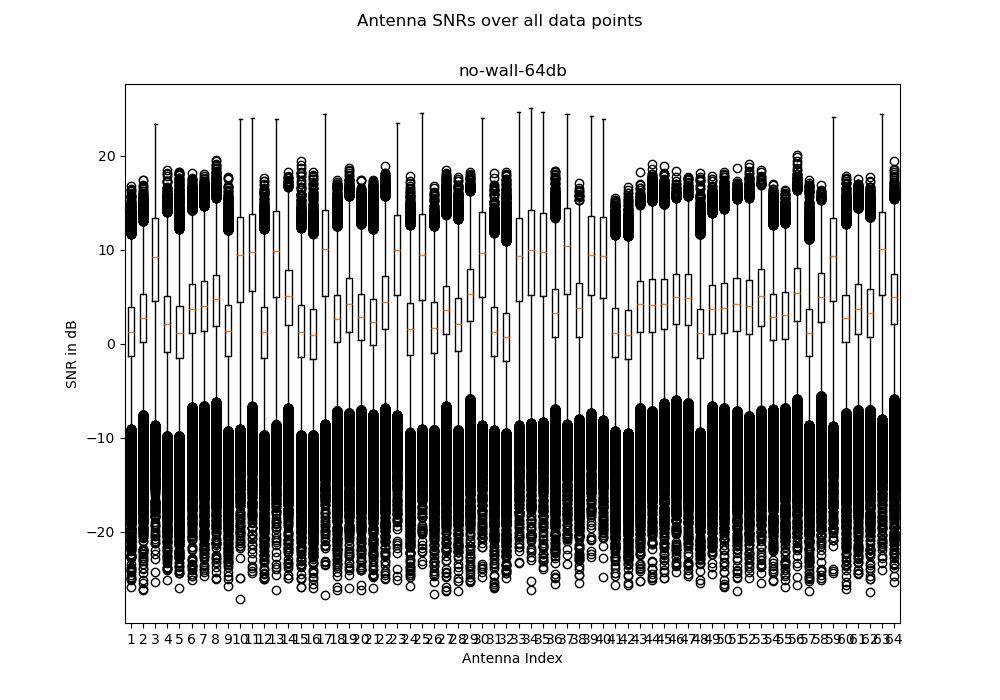


Antenna Configuration
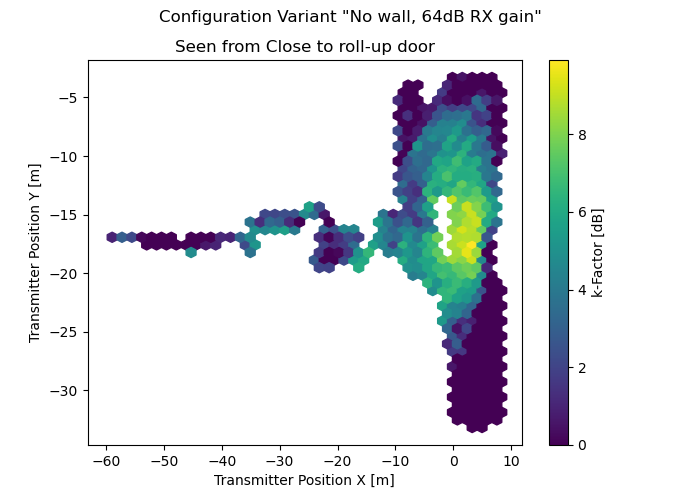
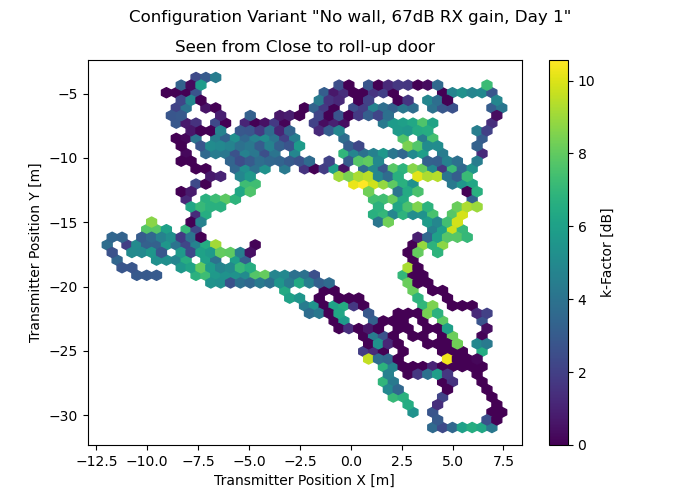
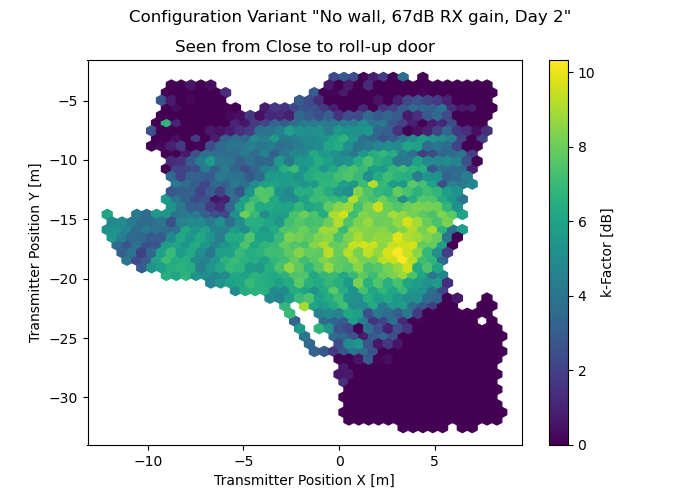
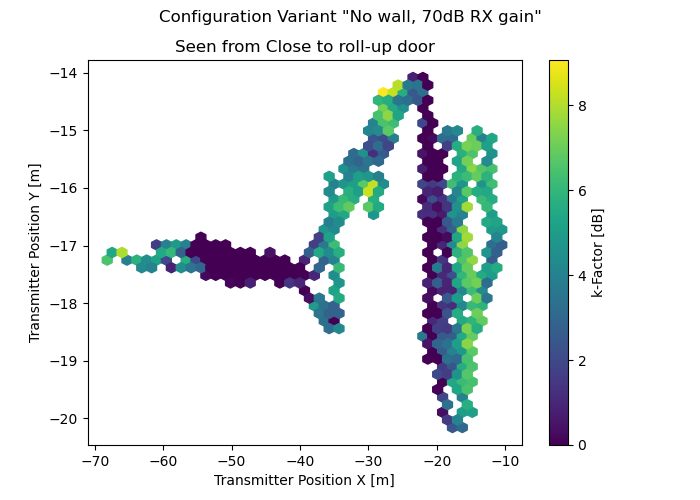
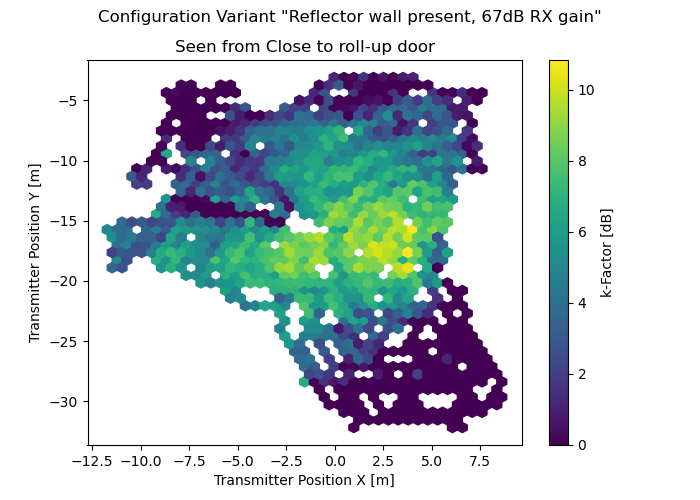
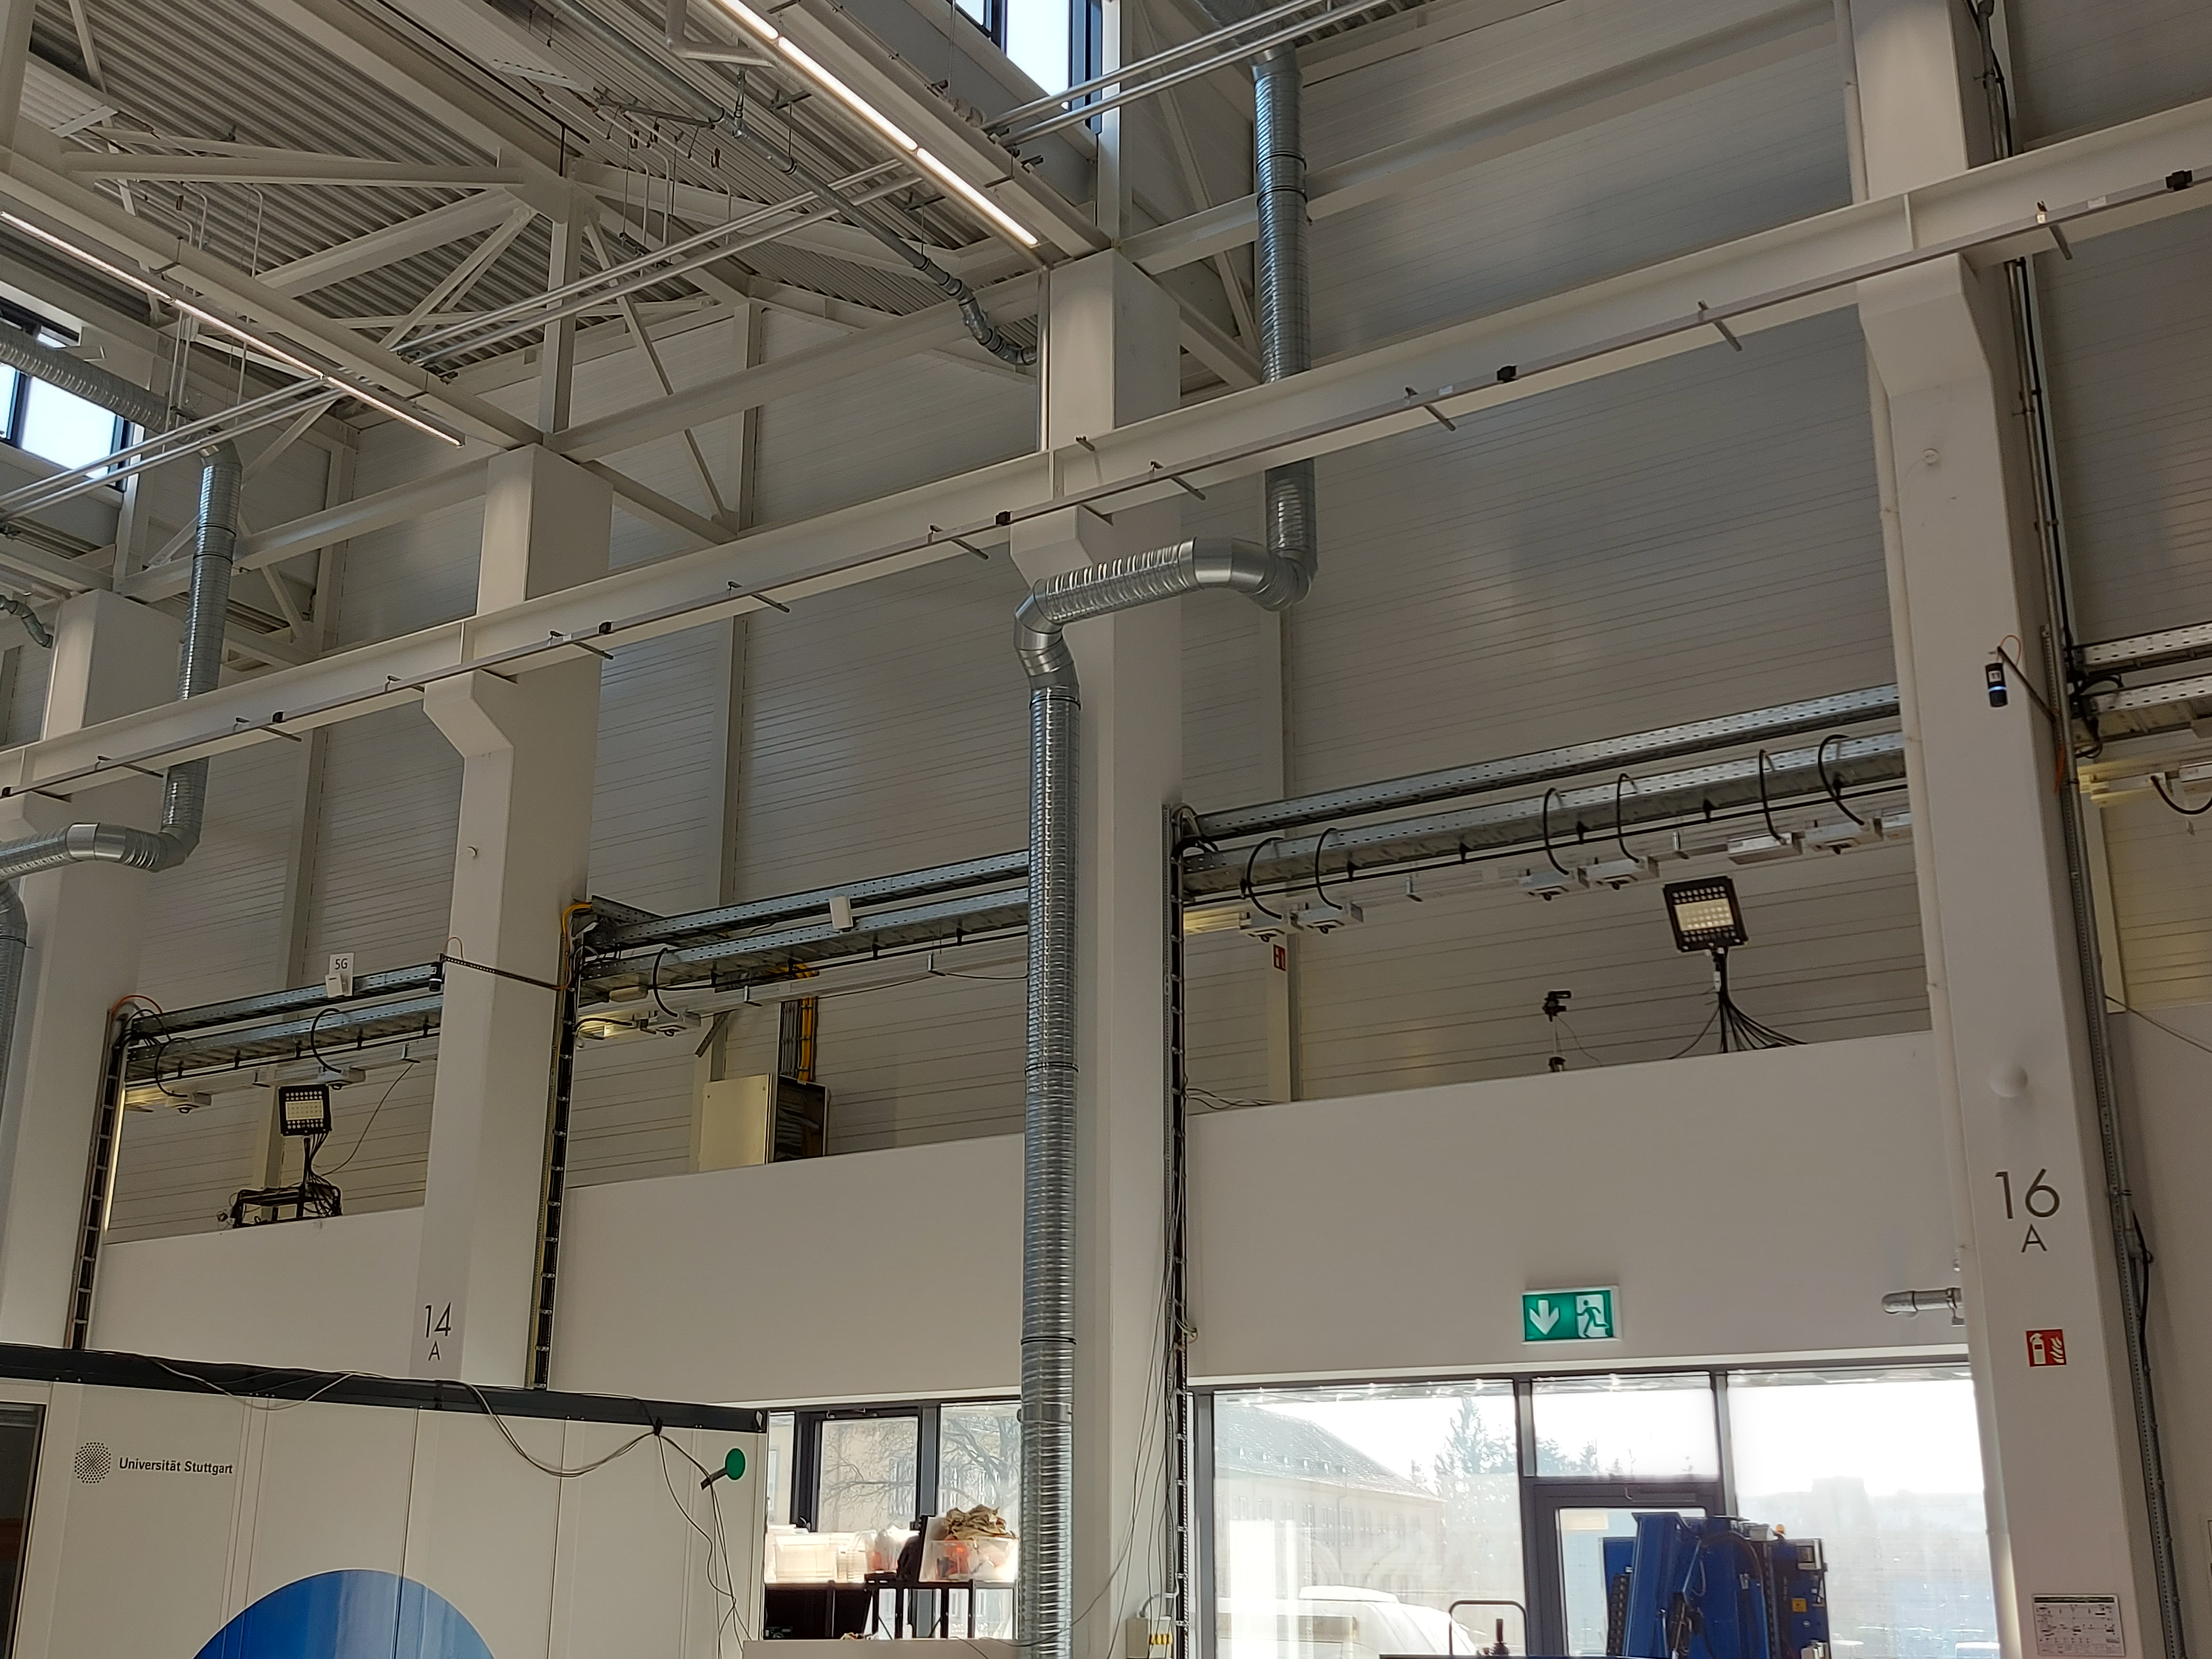
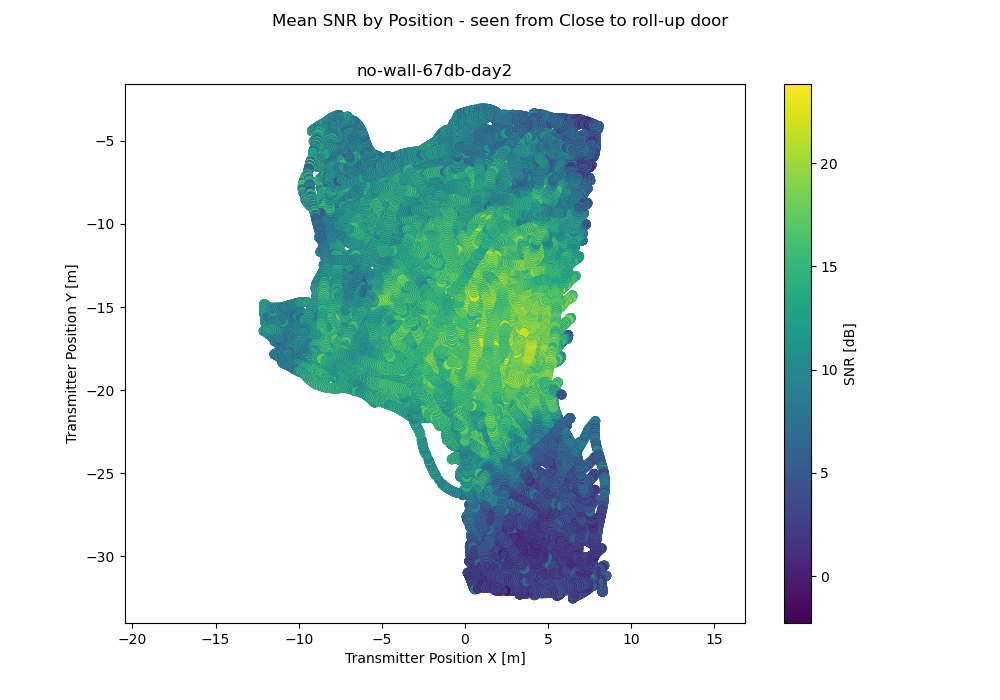
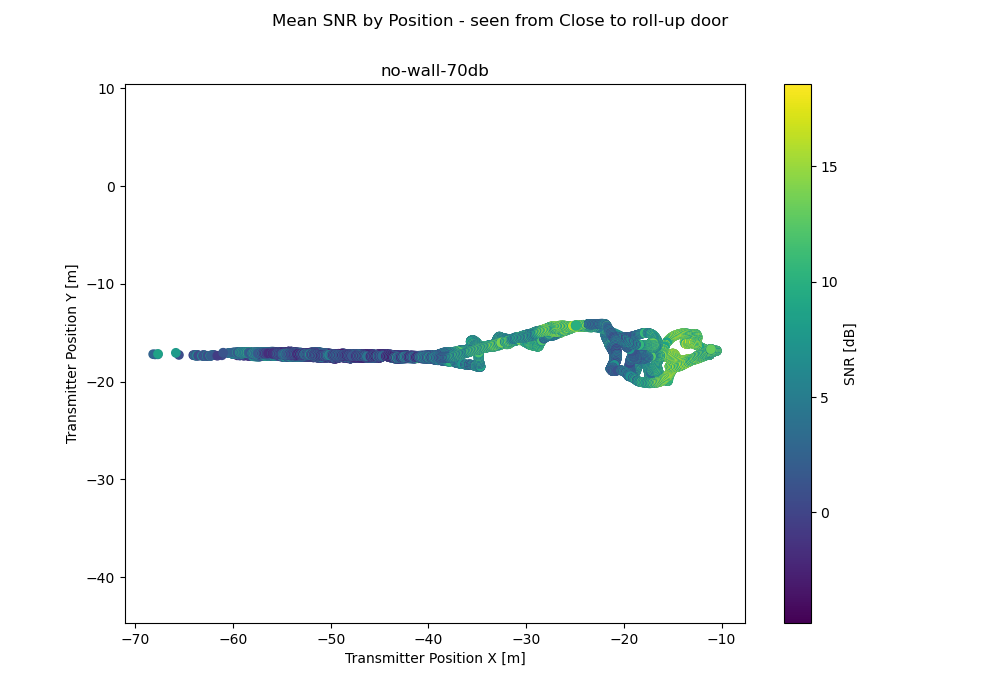
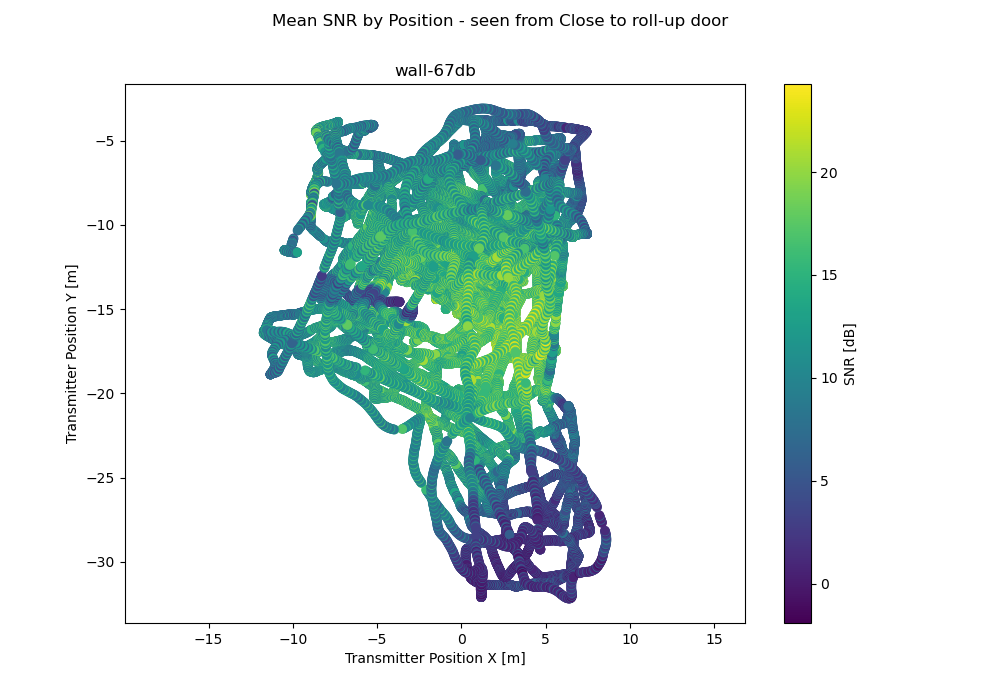
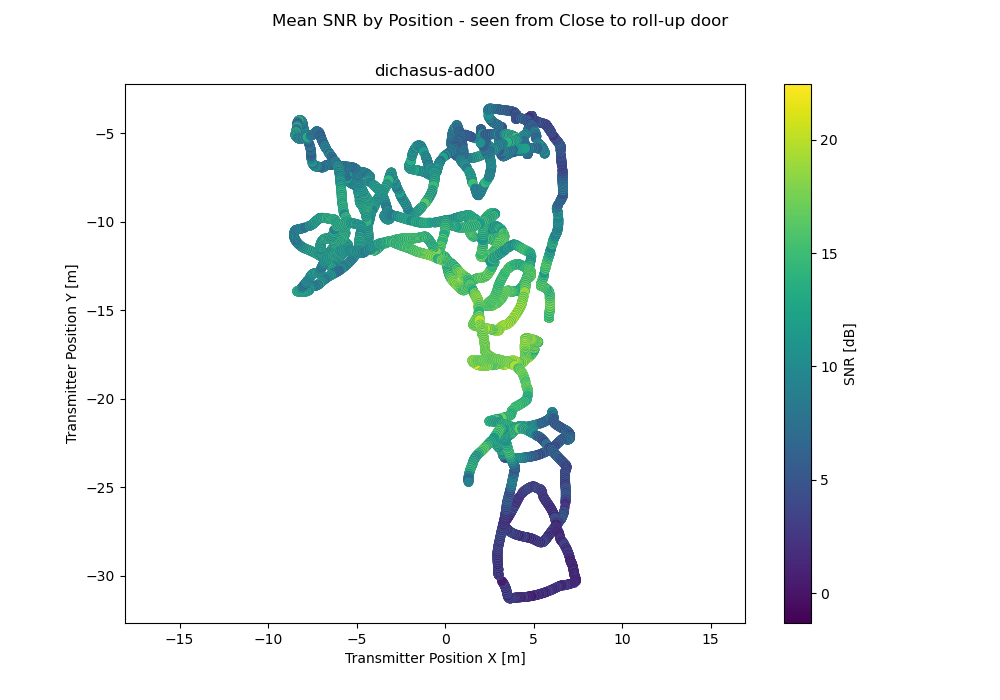
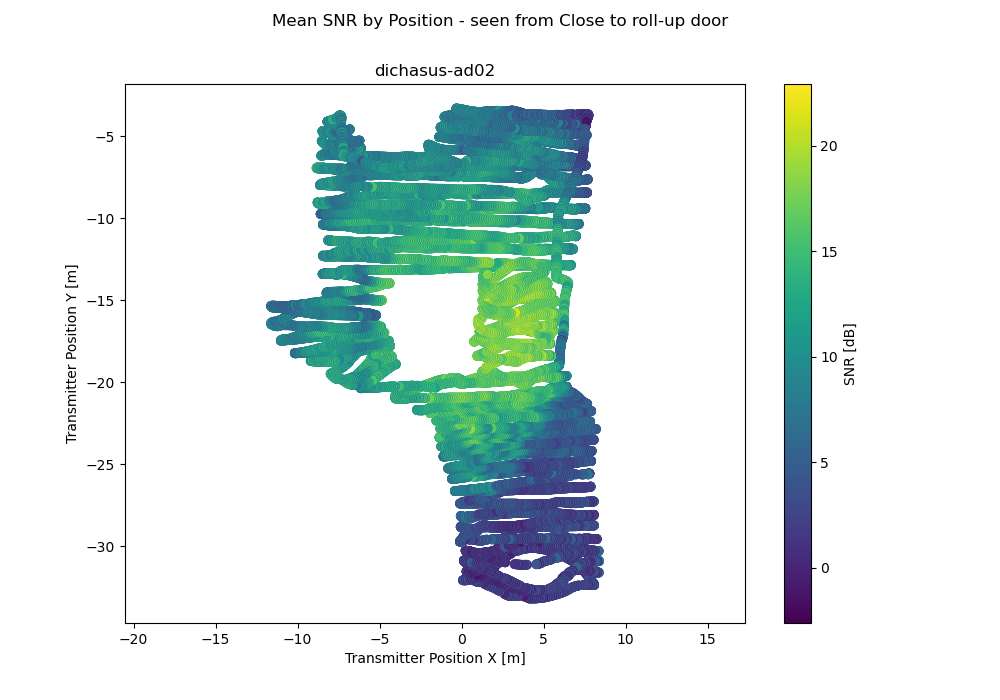
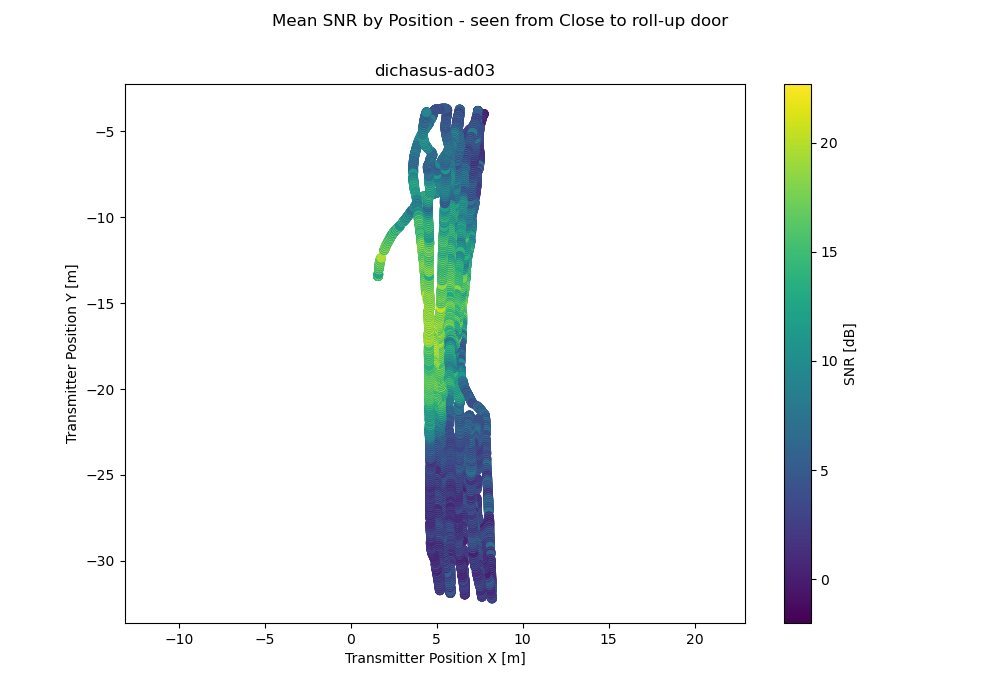
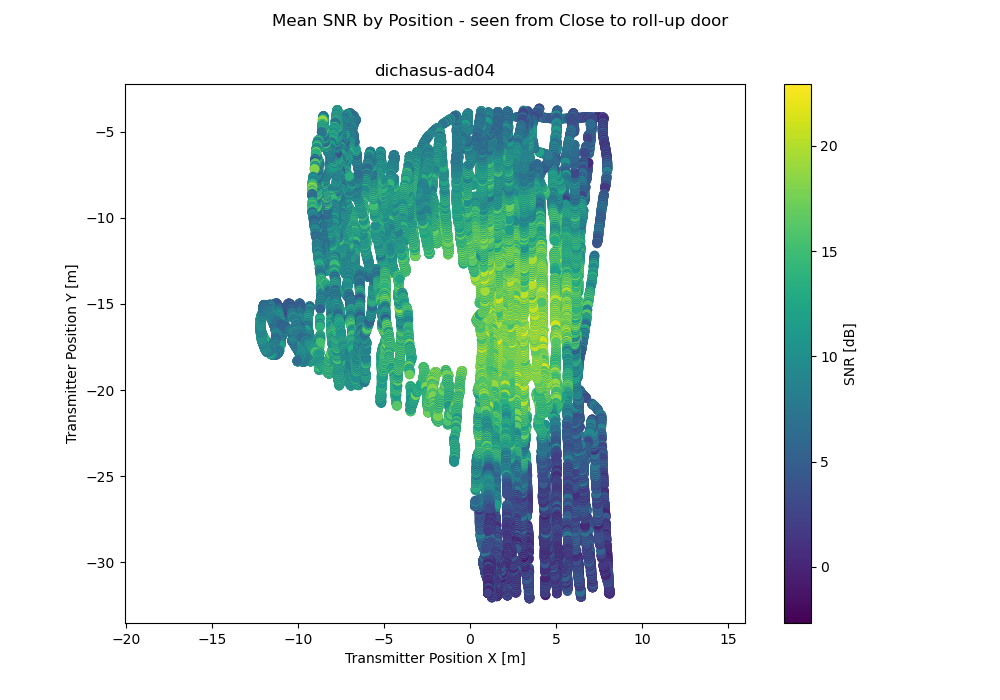
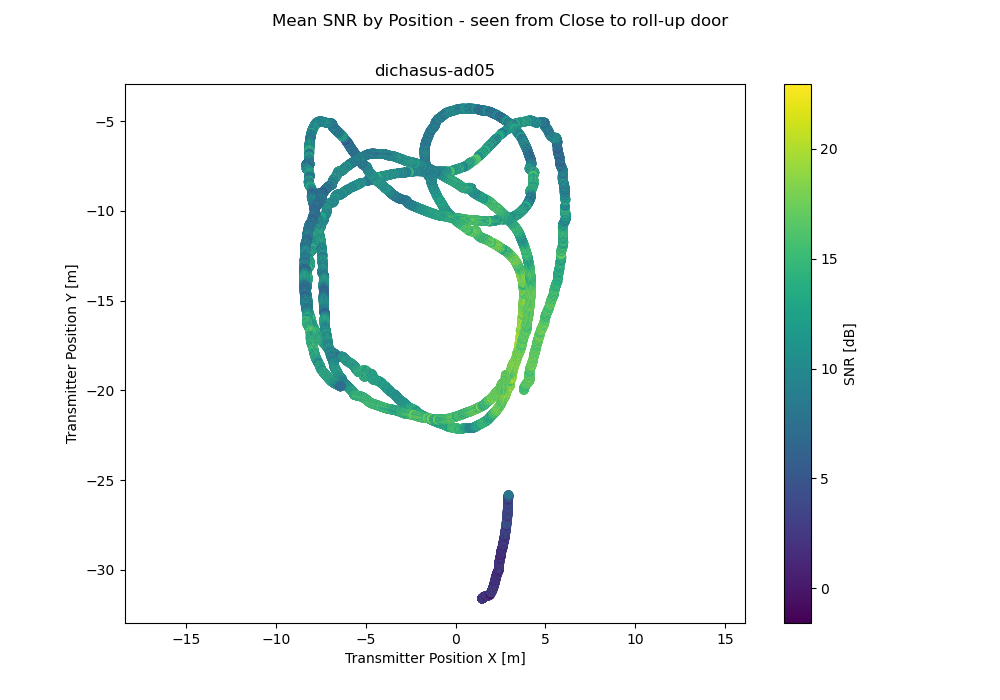
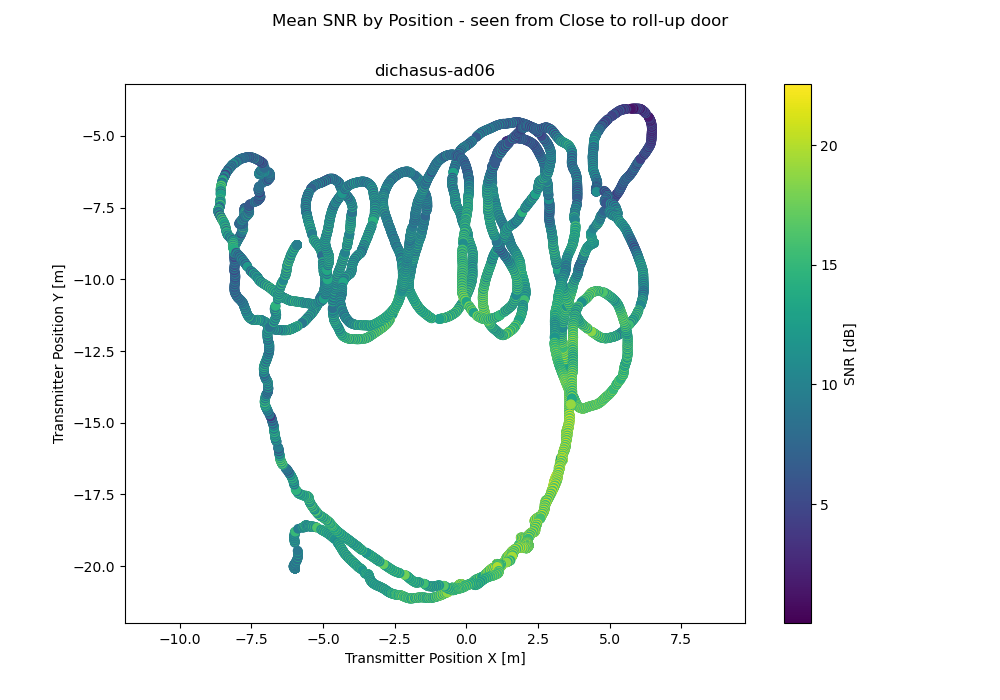
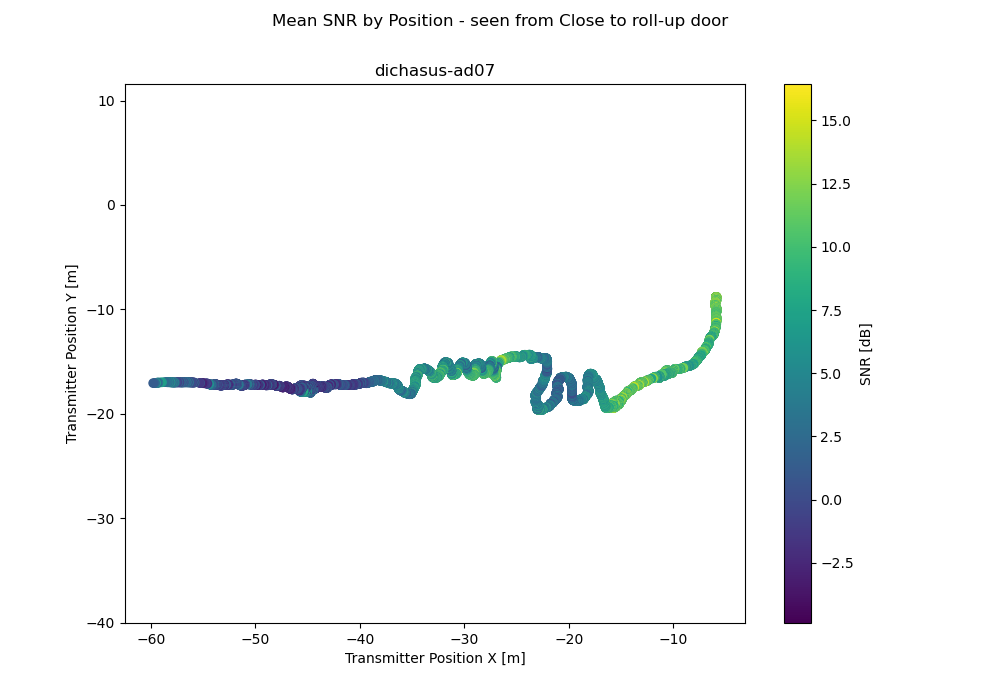
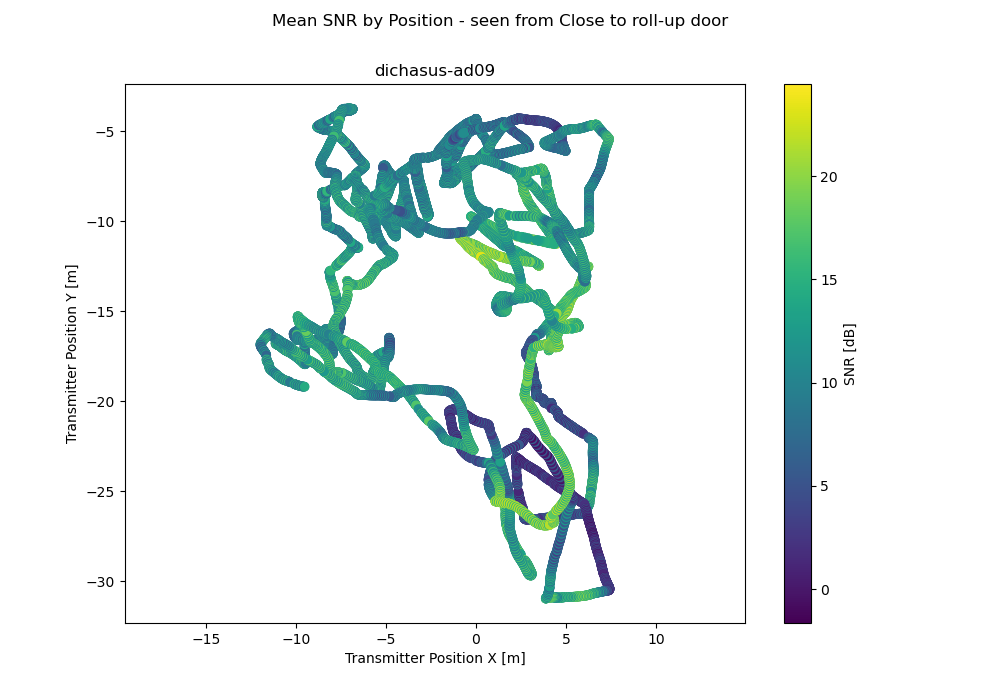
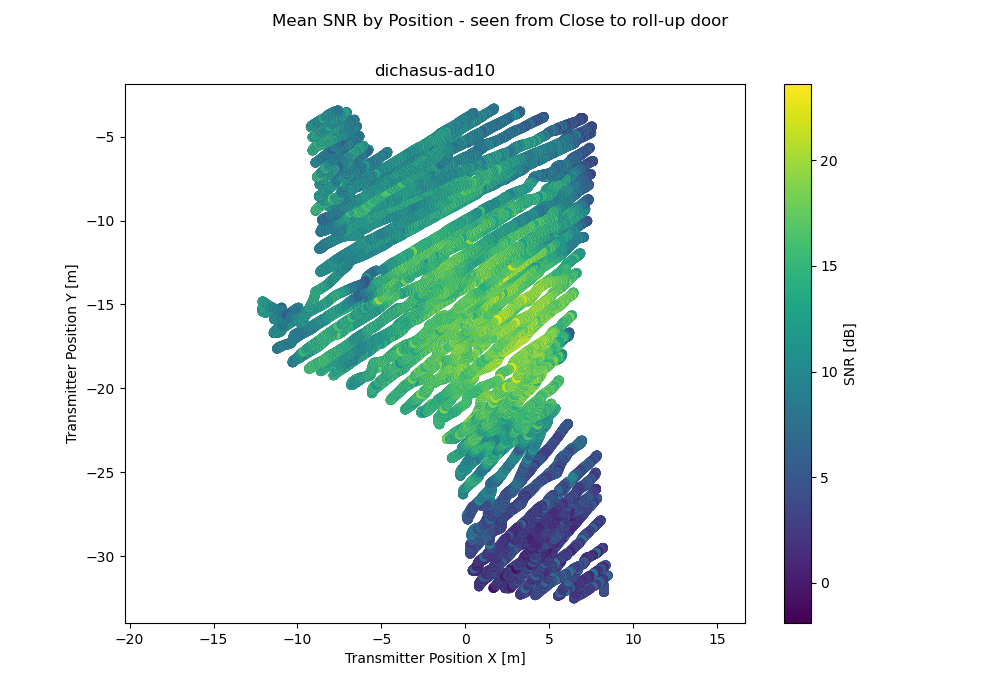
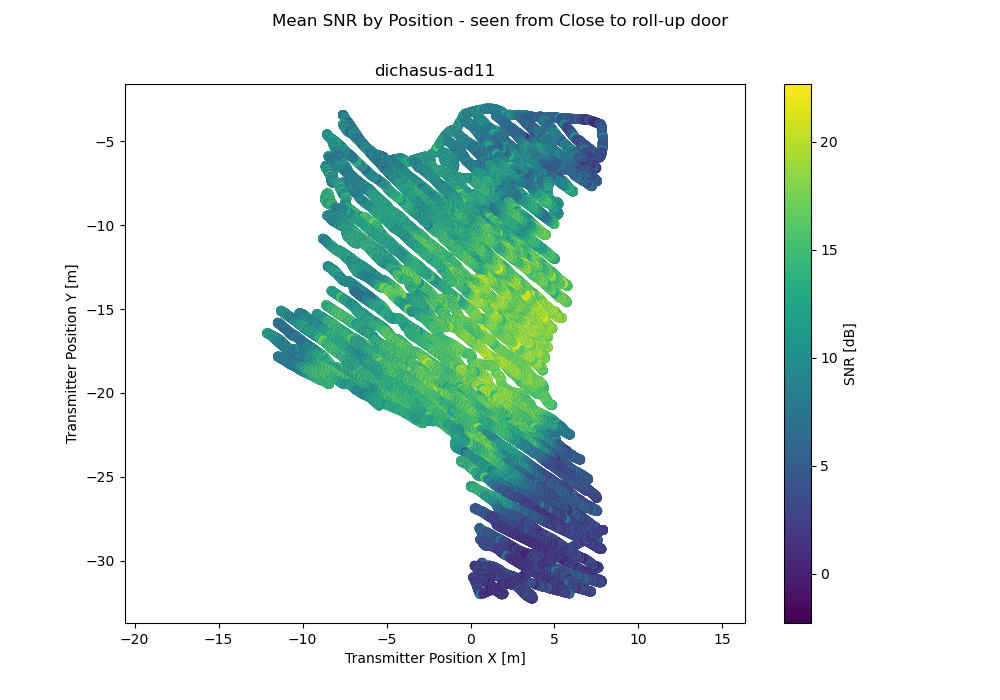
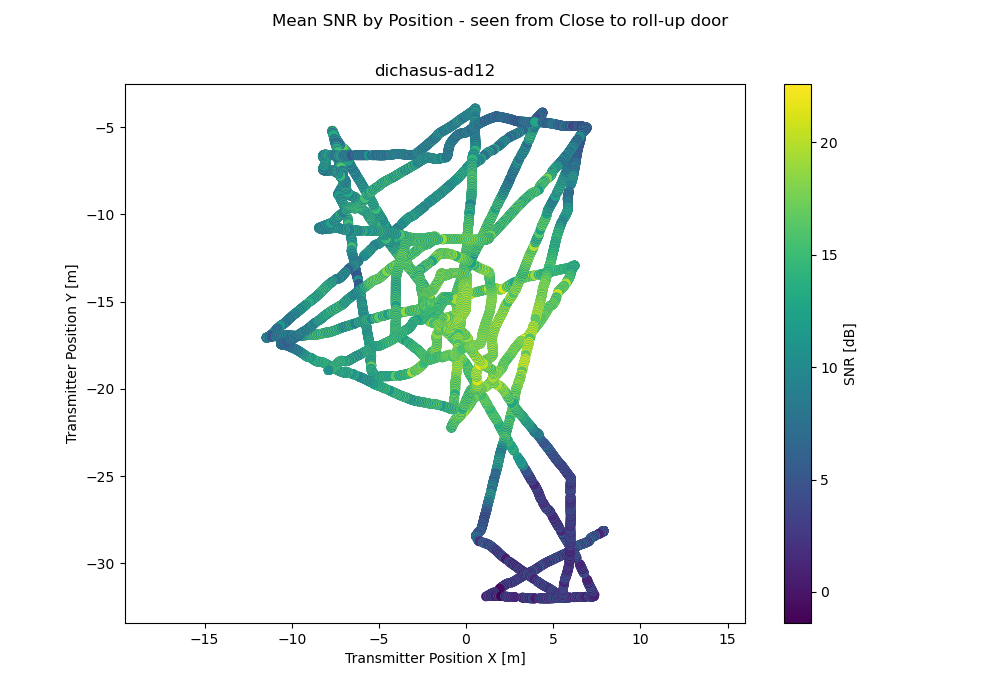
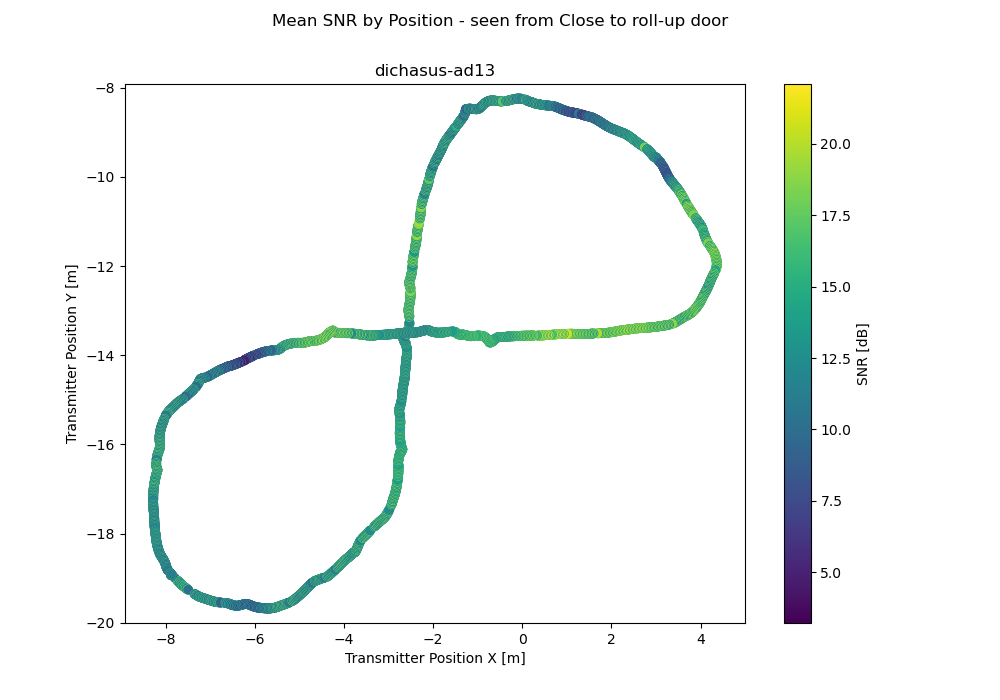
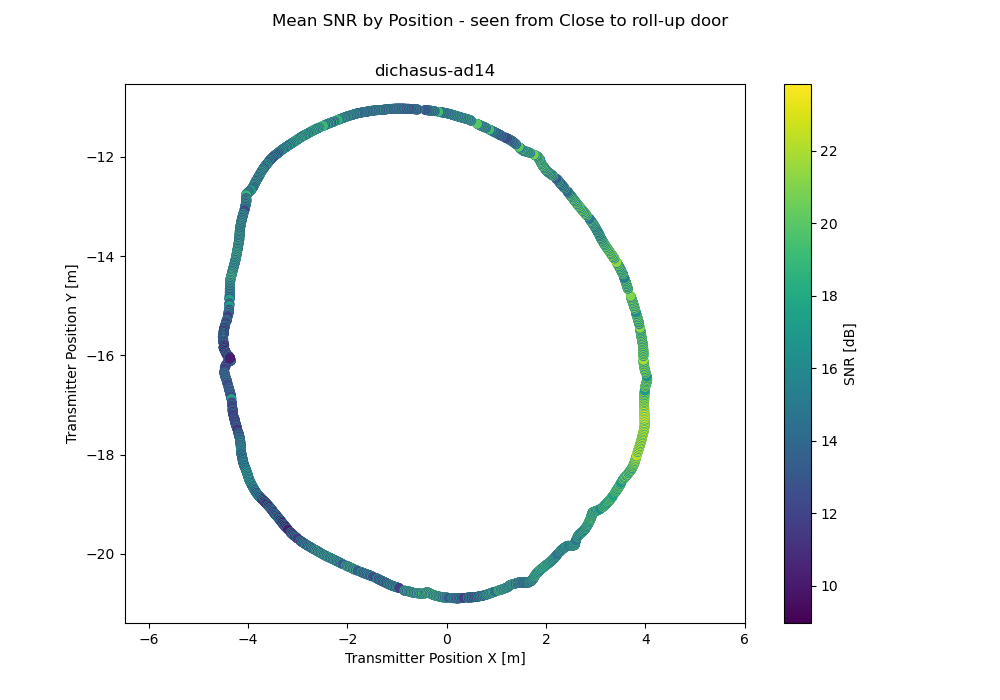
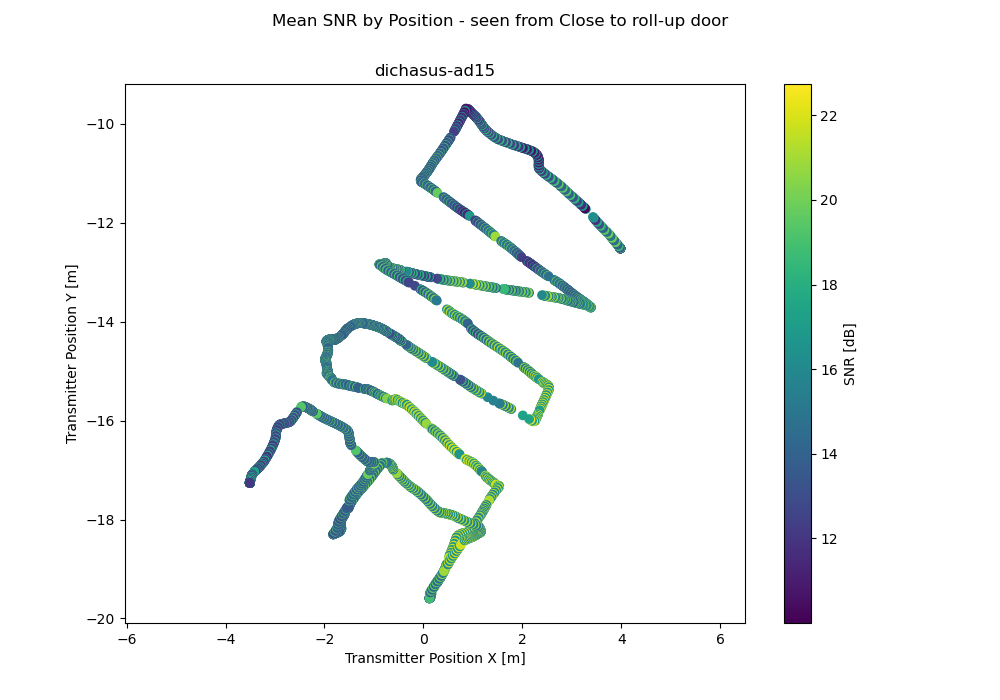
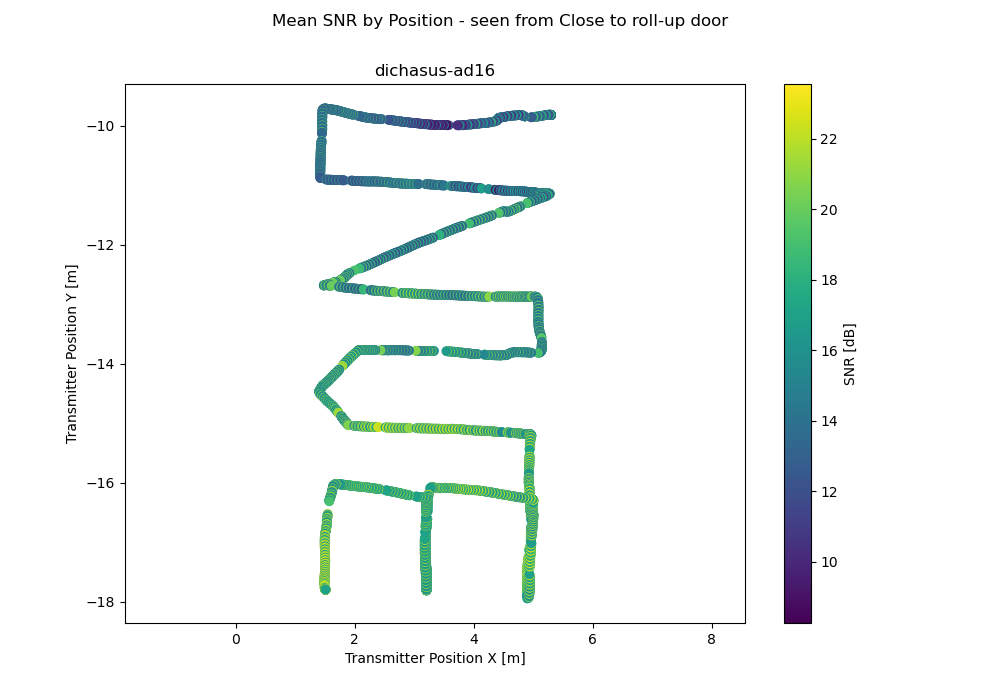
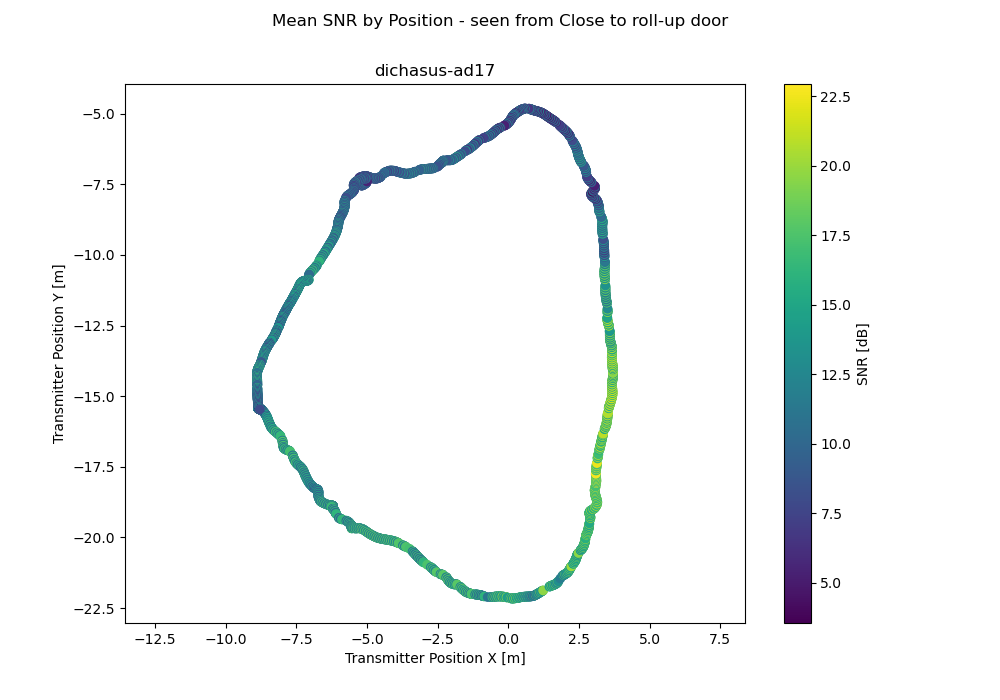
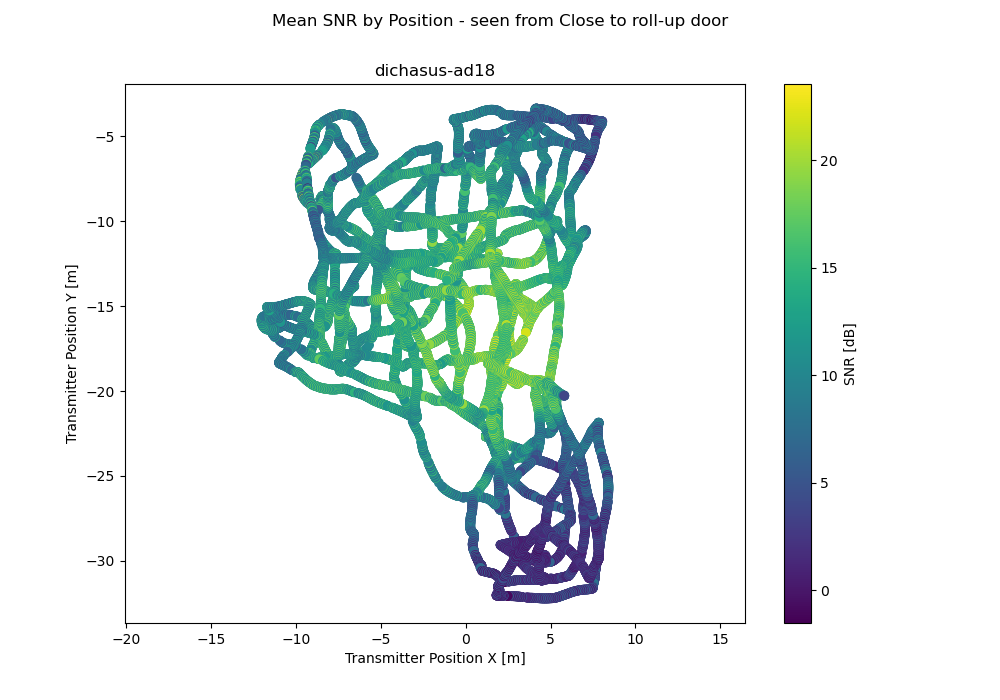
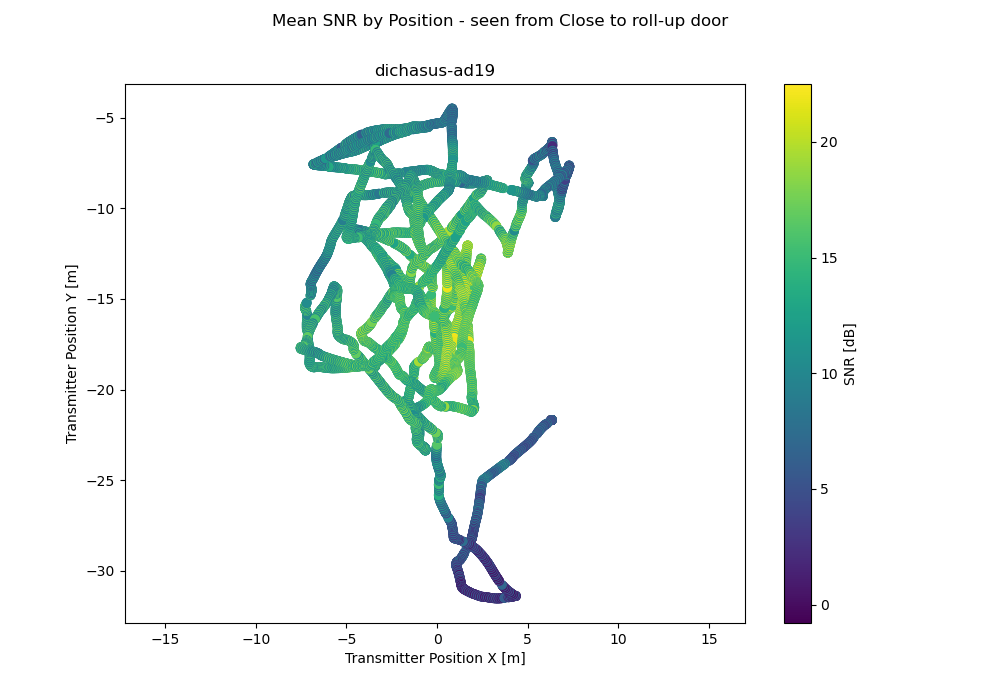
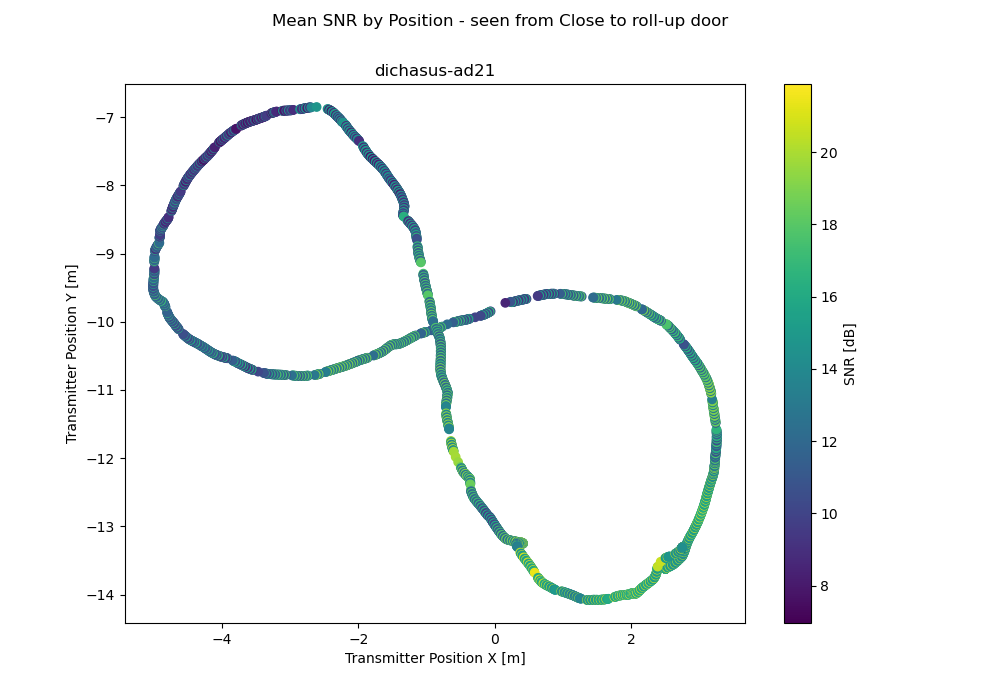
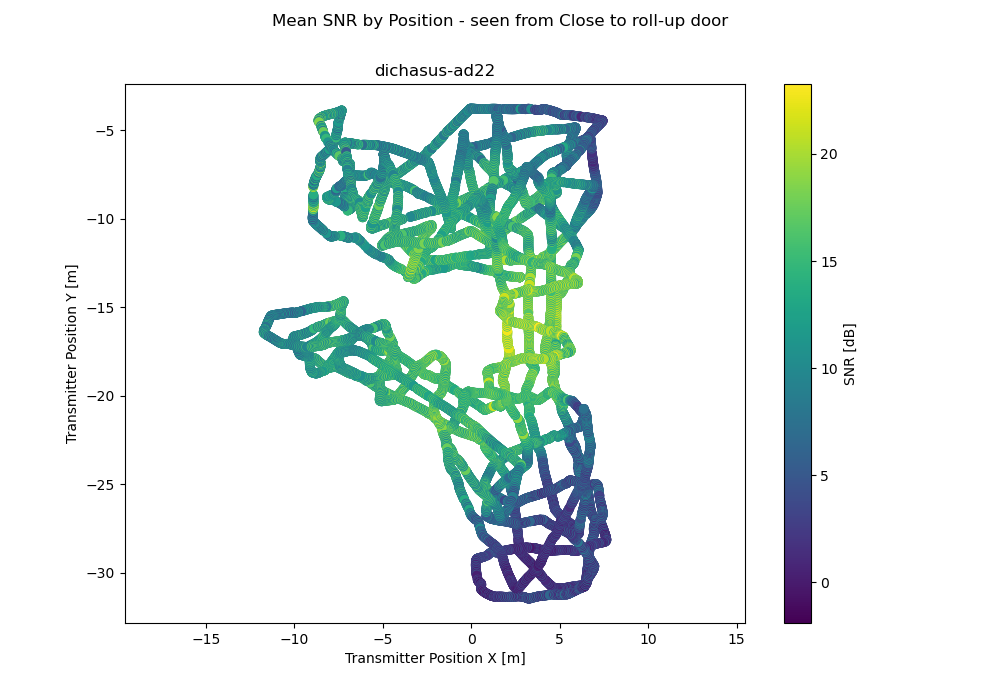
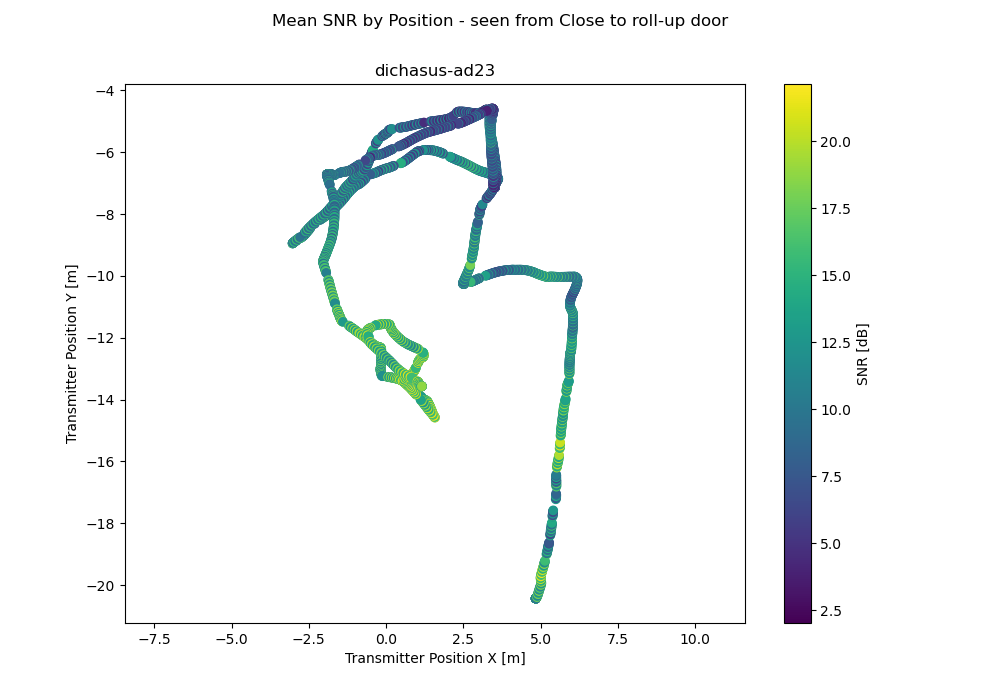
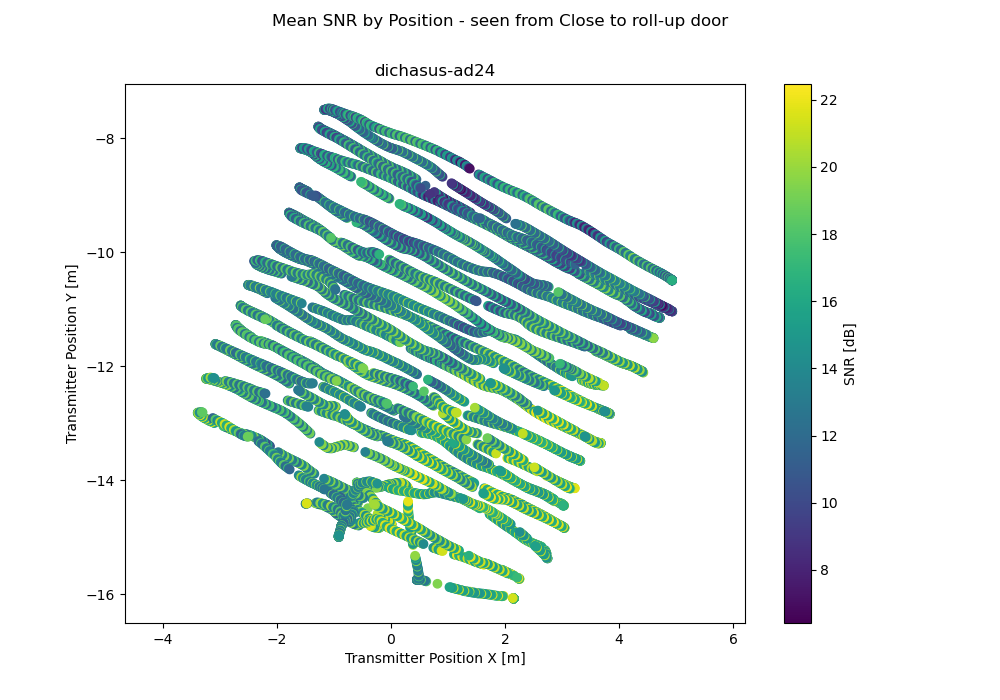
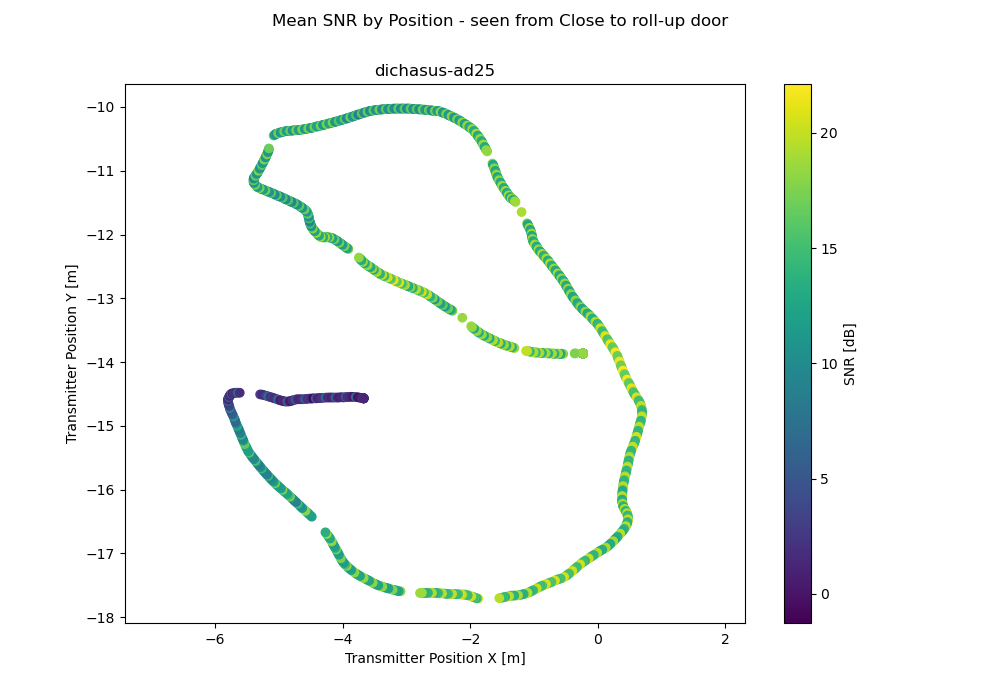
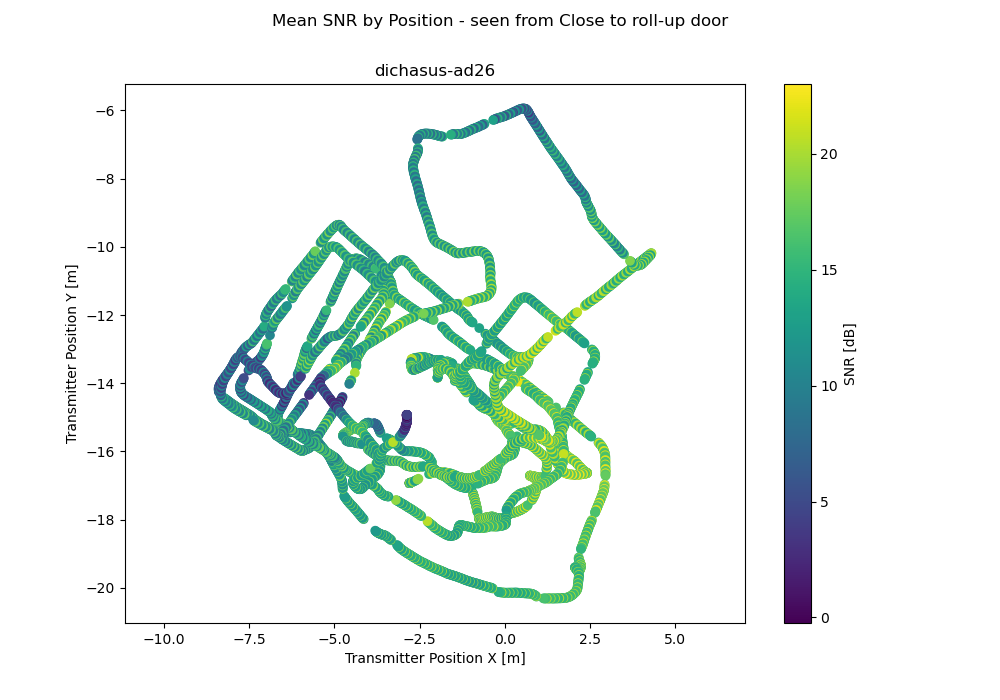
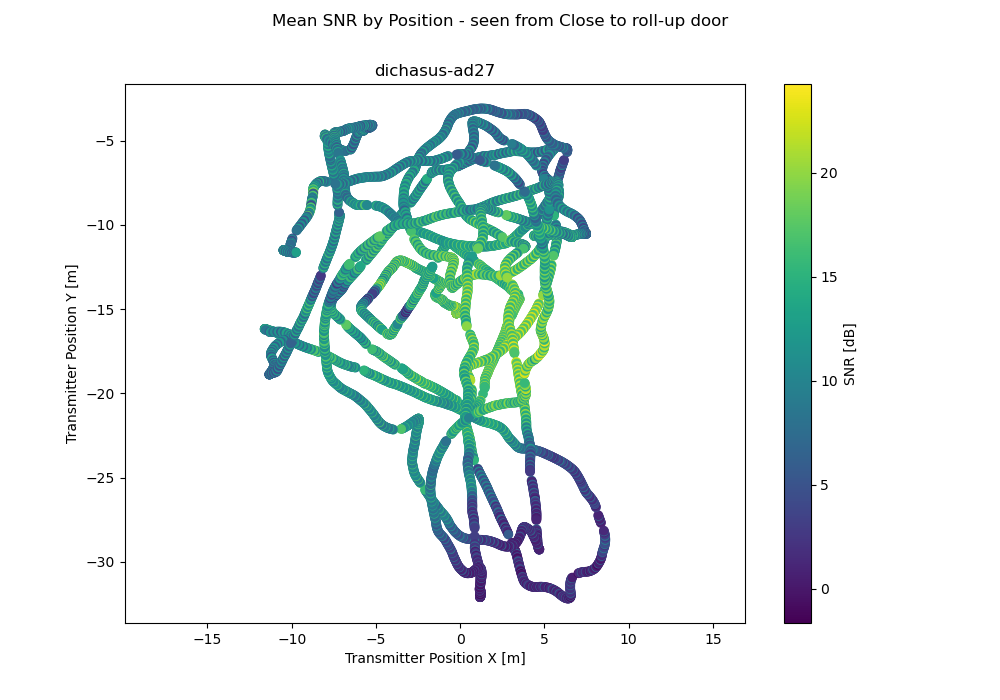
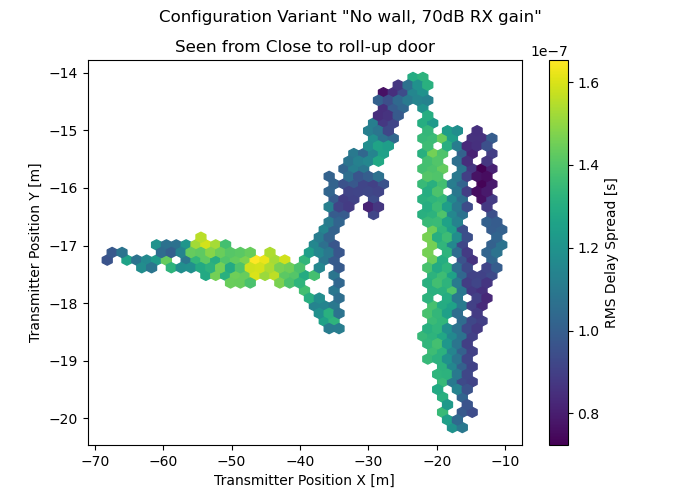
Antenna 1: Close to roll-up door
| 58 | 12 | 24 | 29 | 16 | 2 | 33 | 38 |
| 34 | 9 | 36 | 32 | 22 | 62 | 39 | 10 |
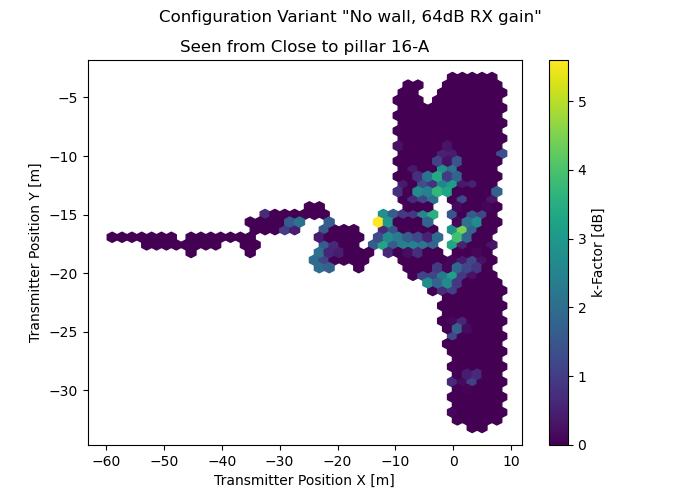
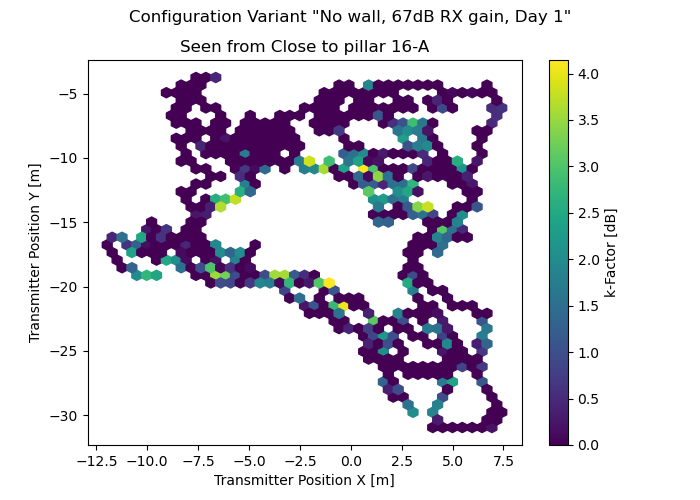
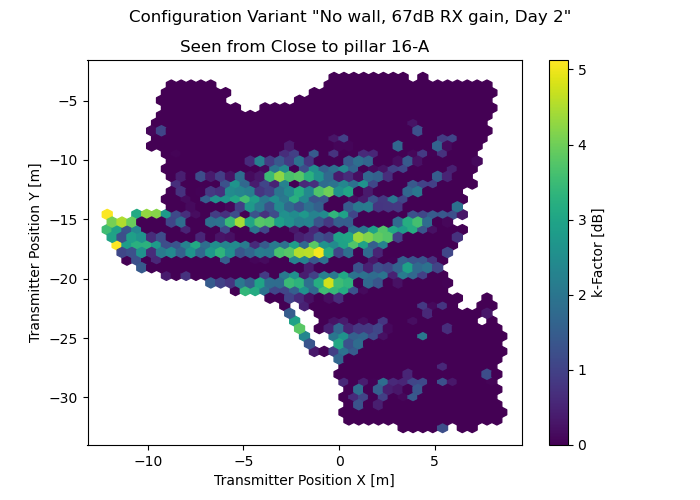
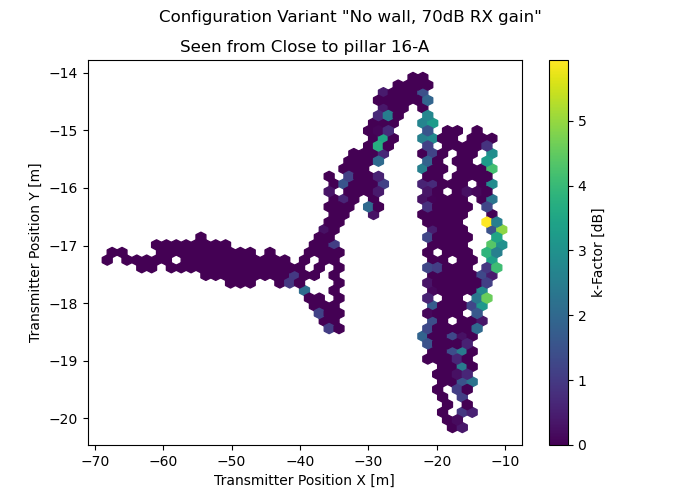
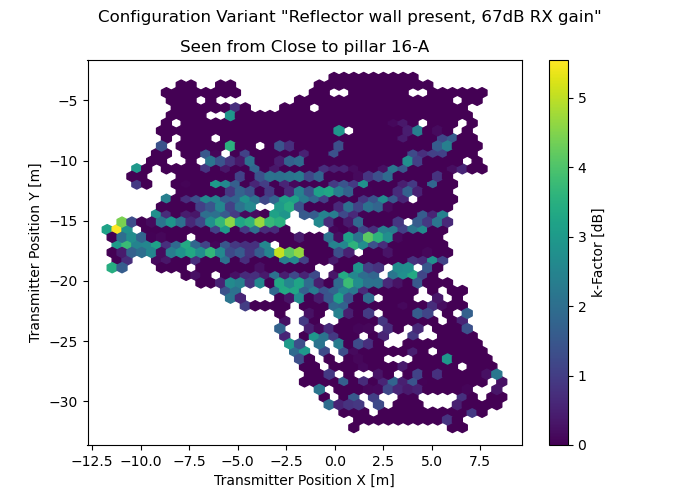
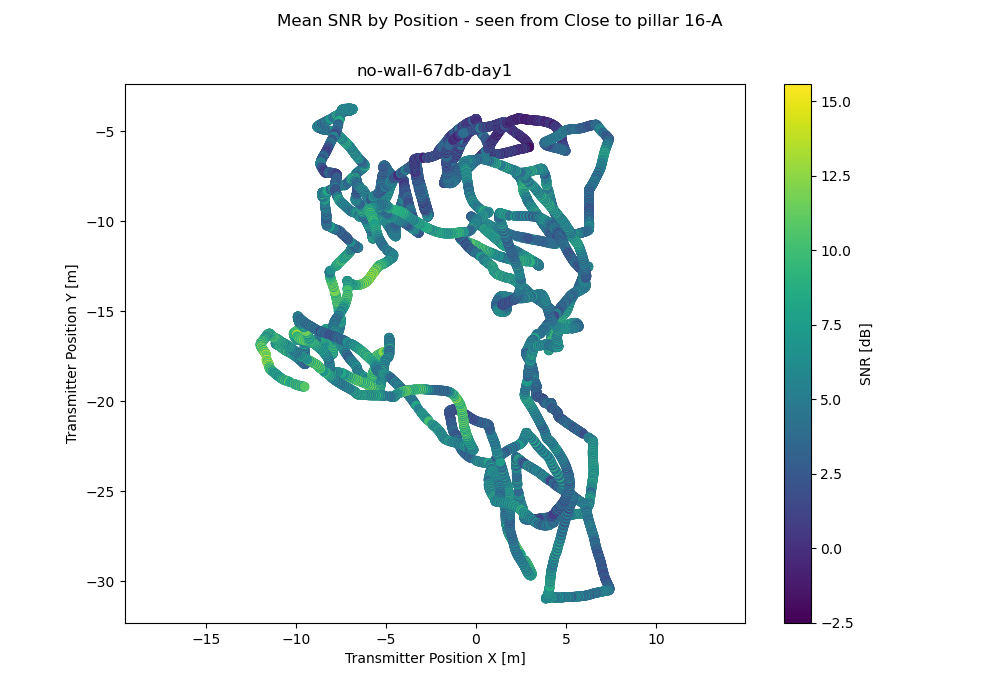
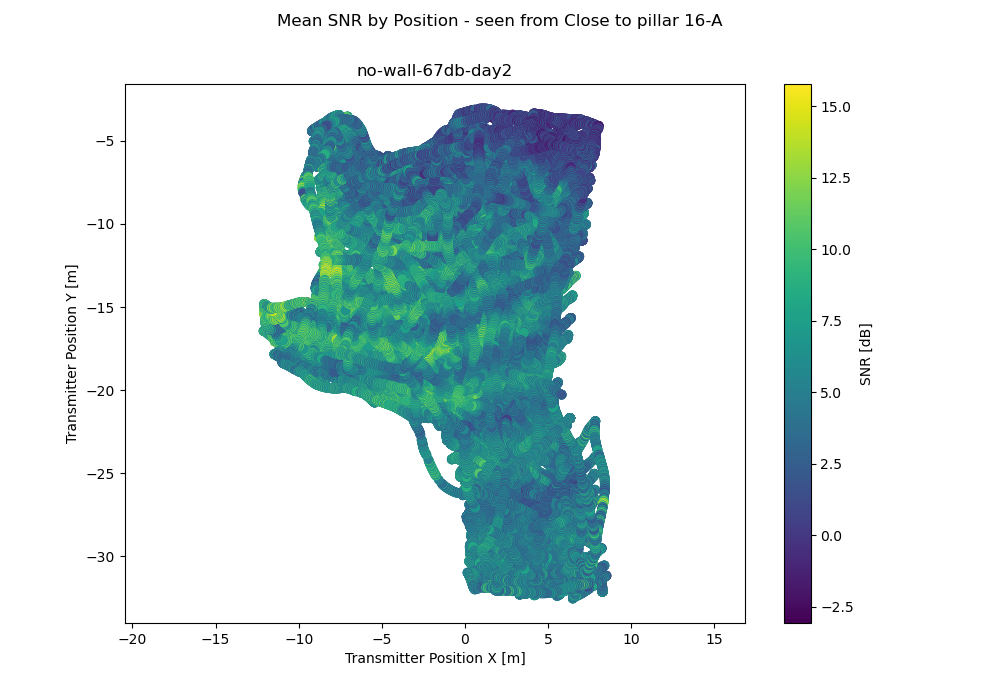
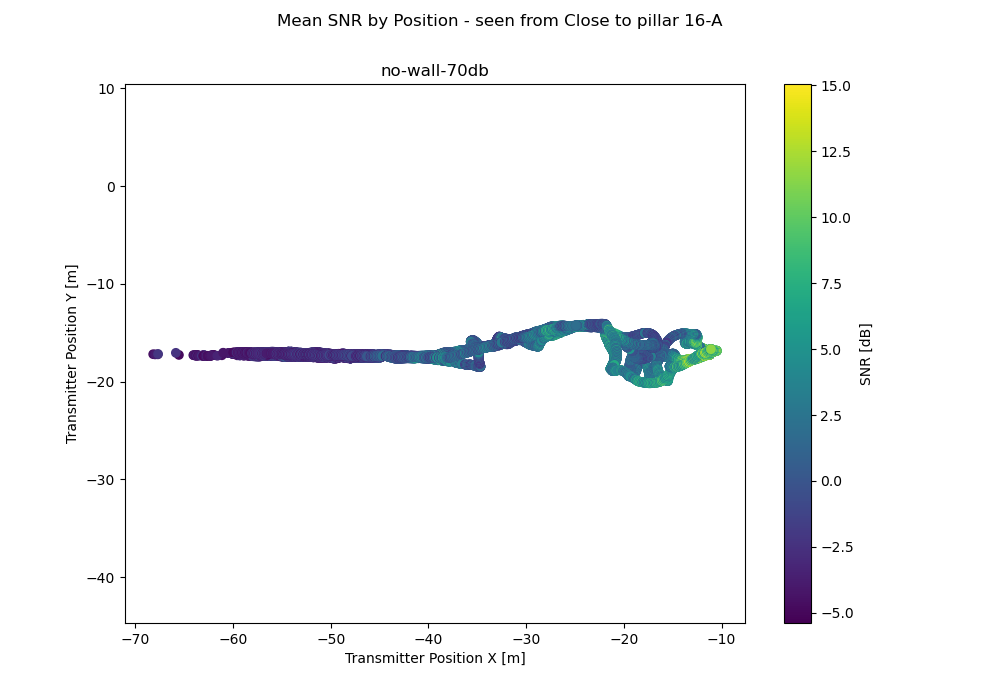
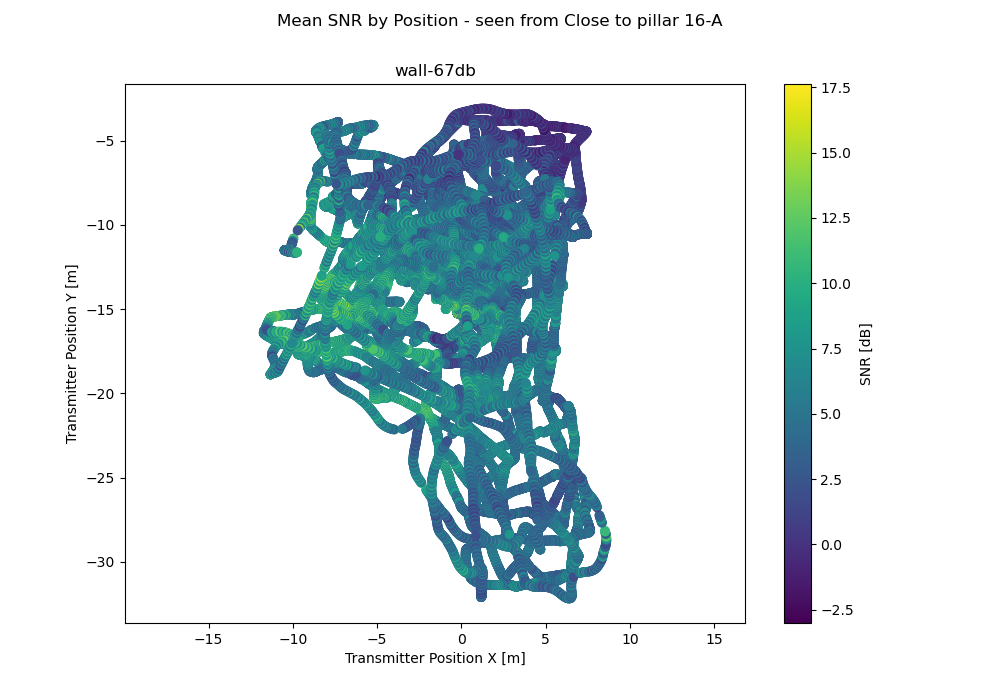
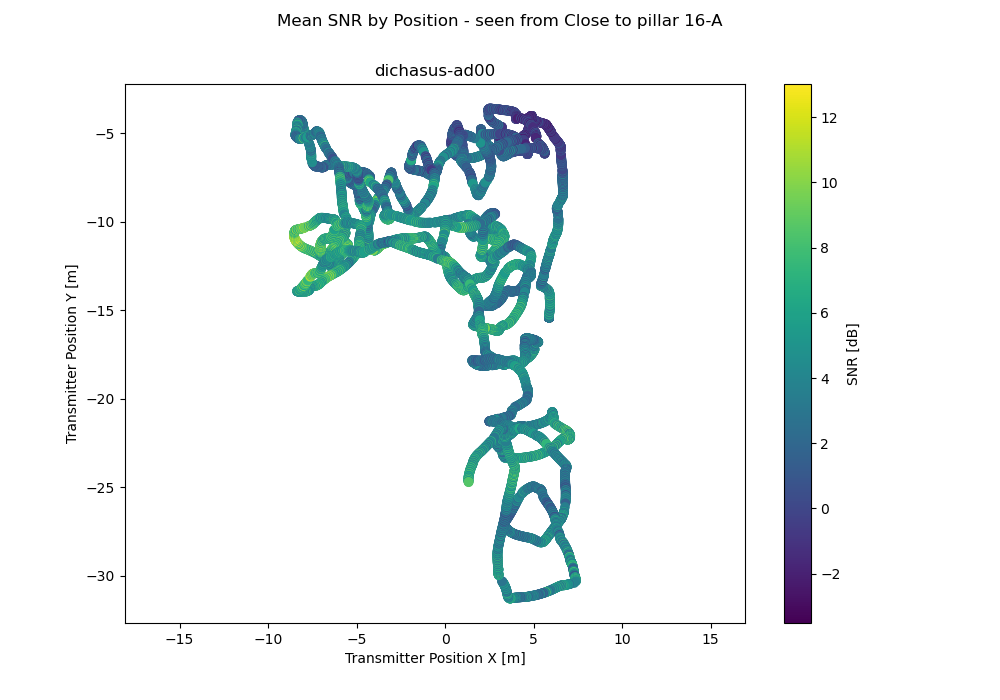
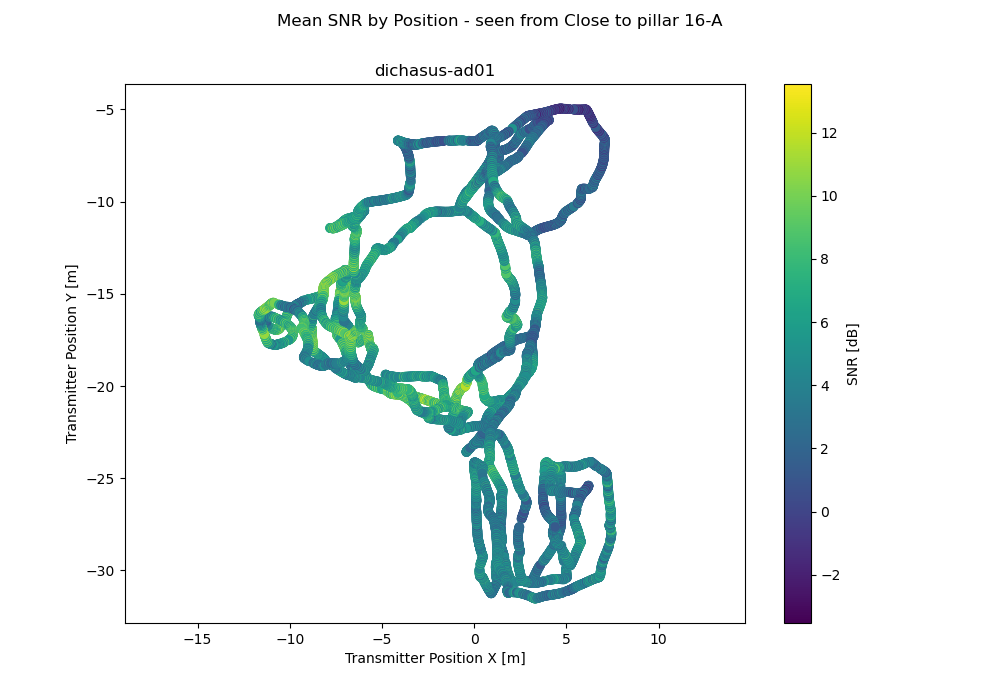
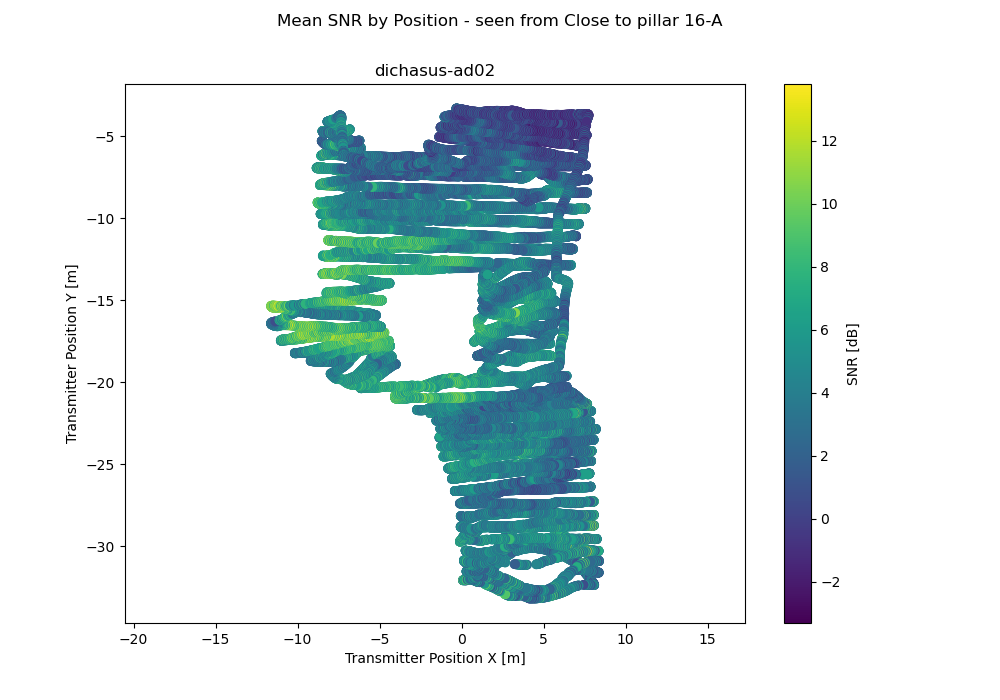
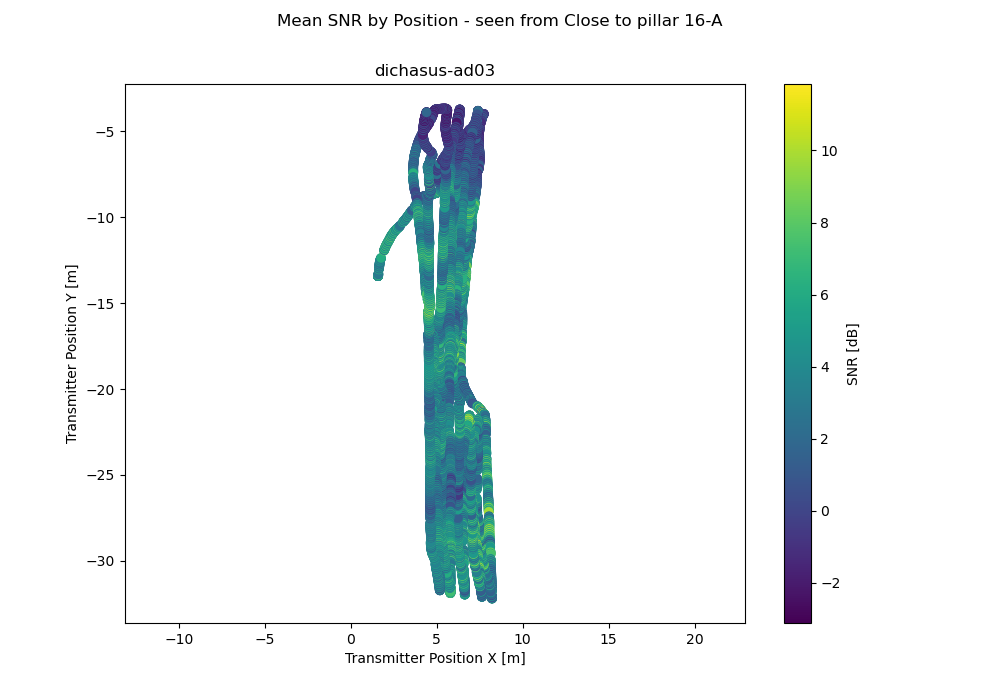
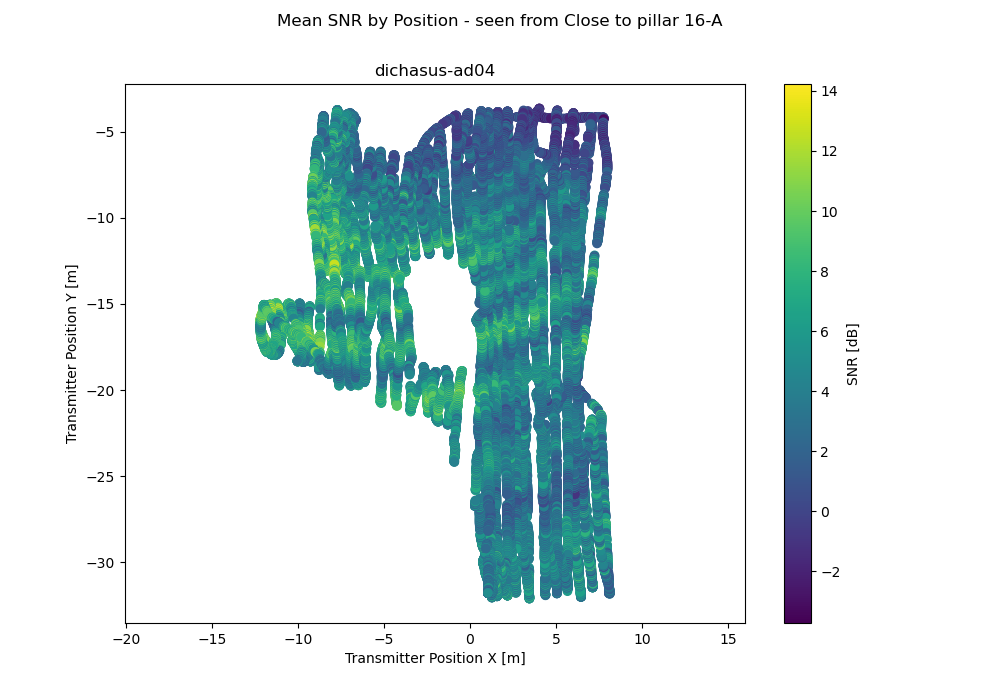
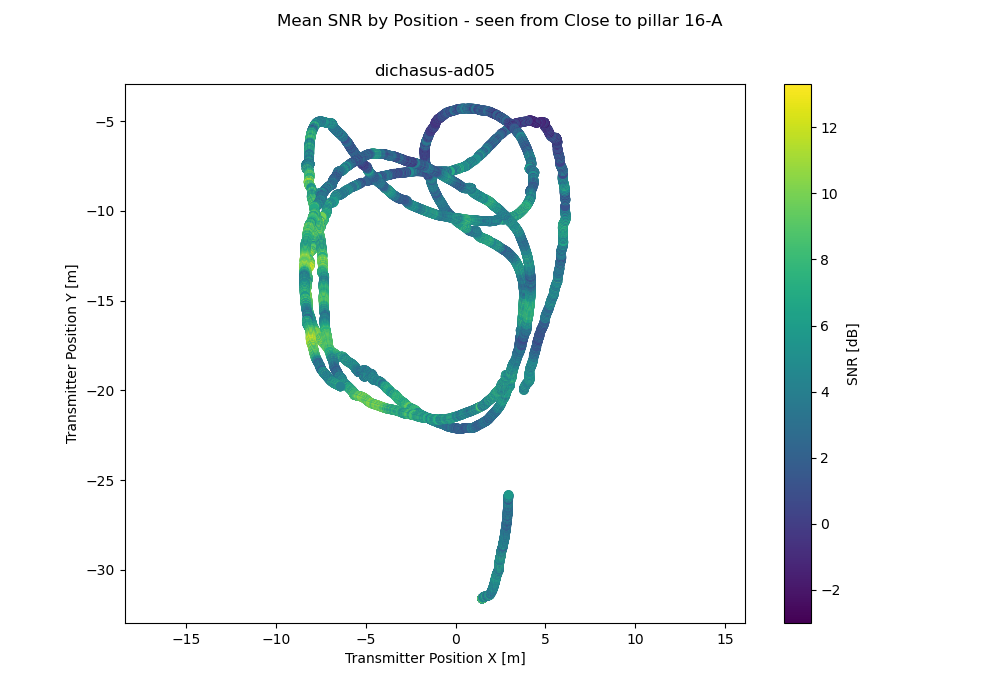
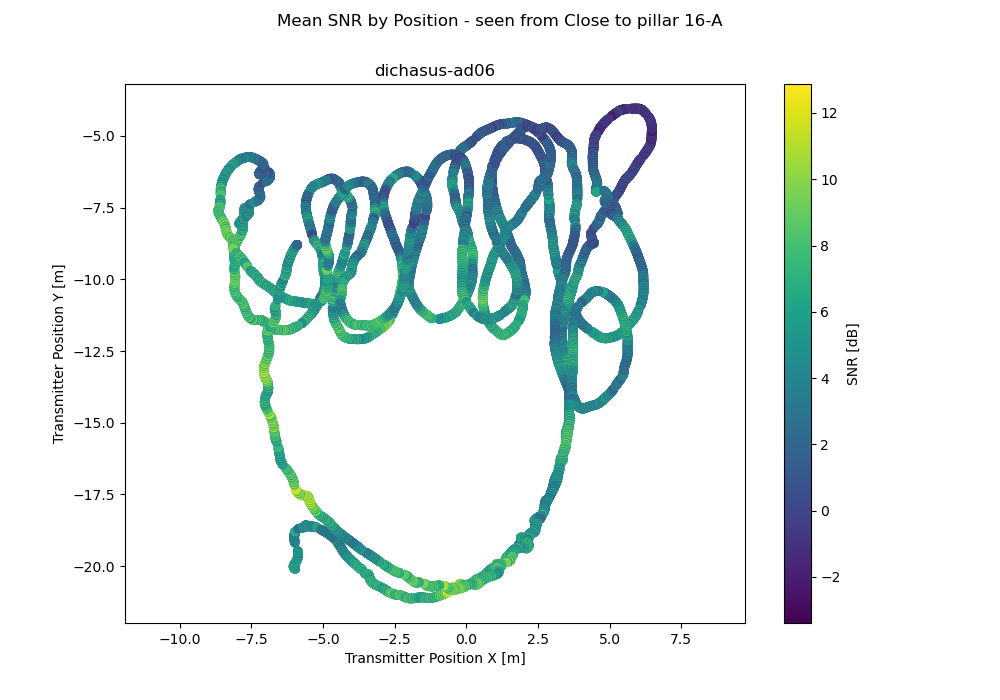
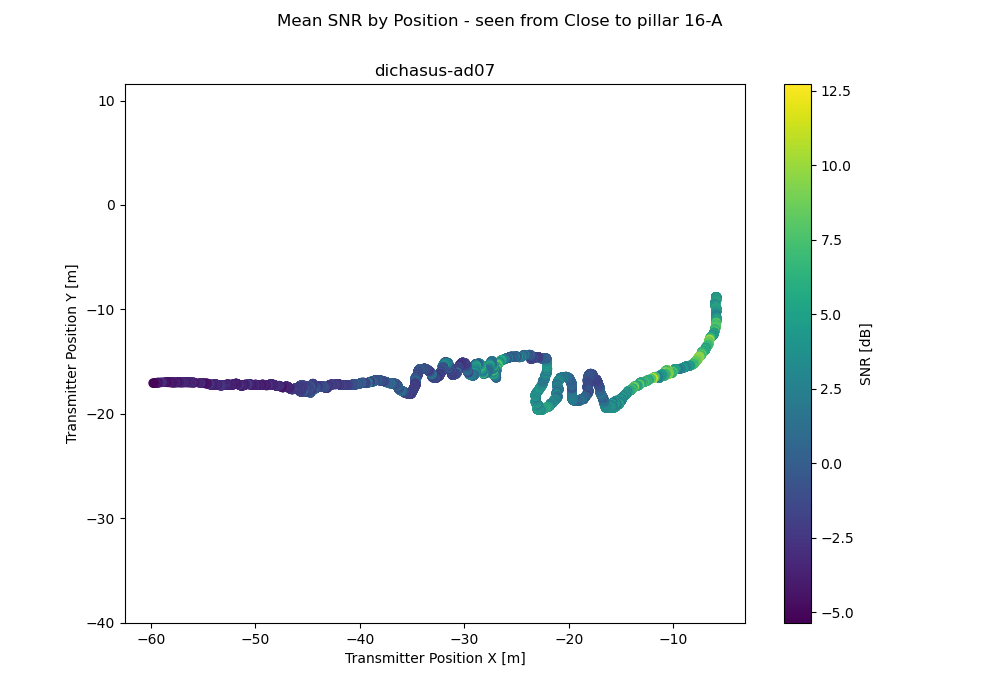
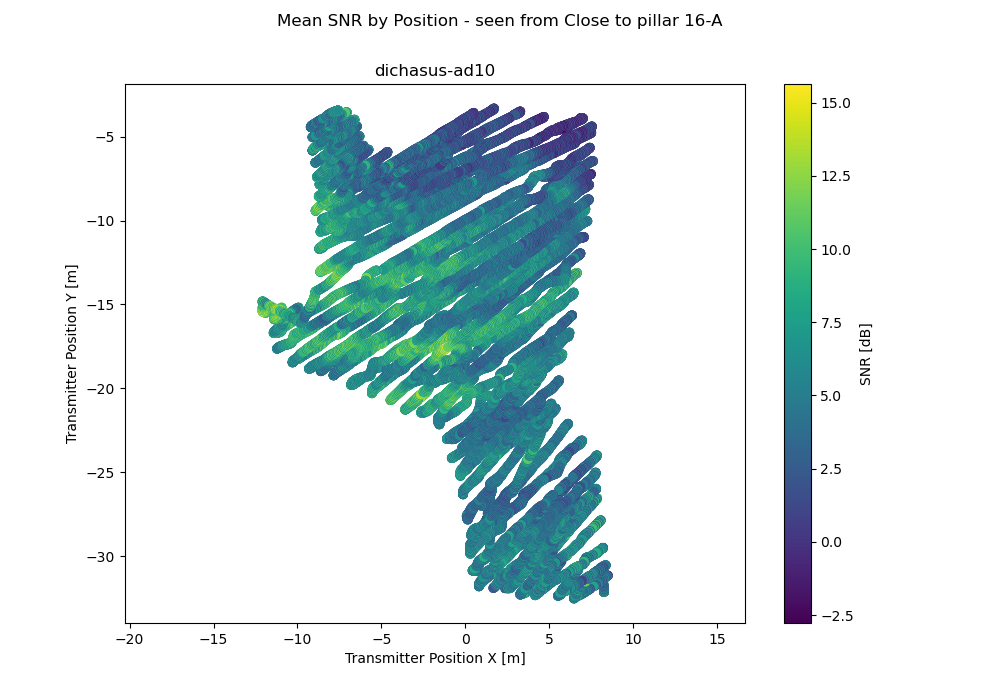
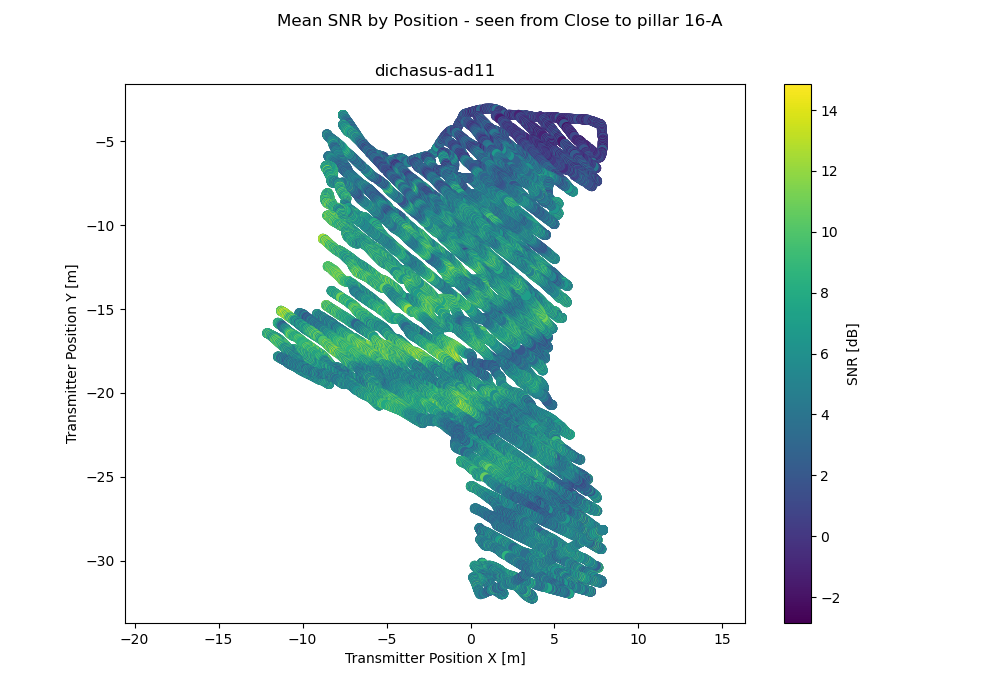
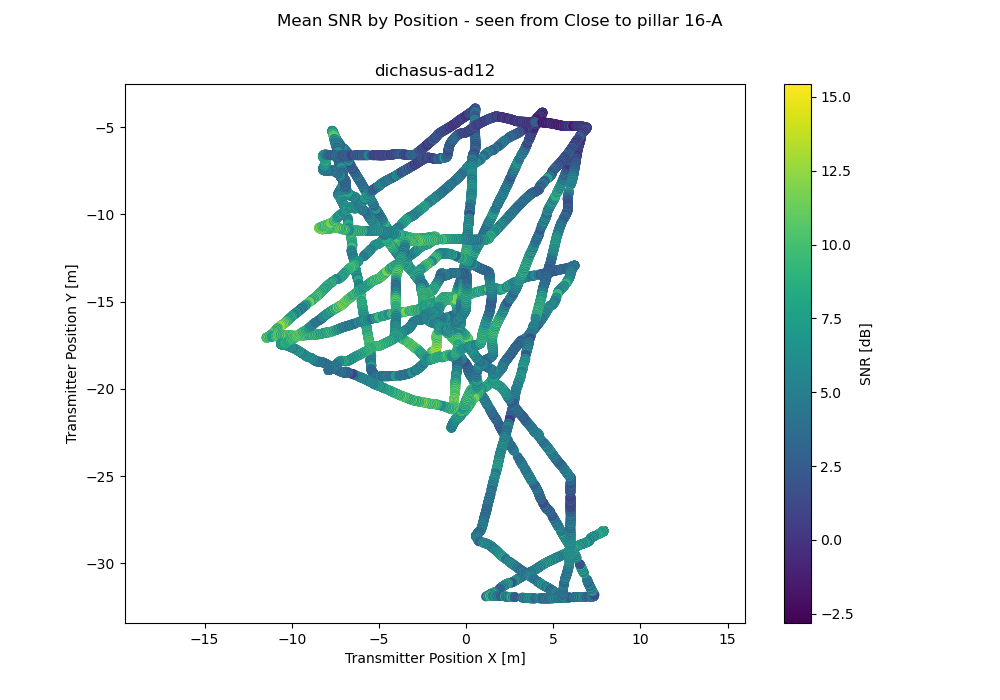
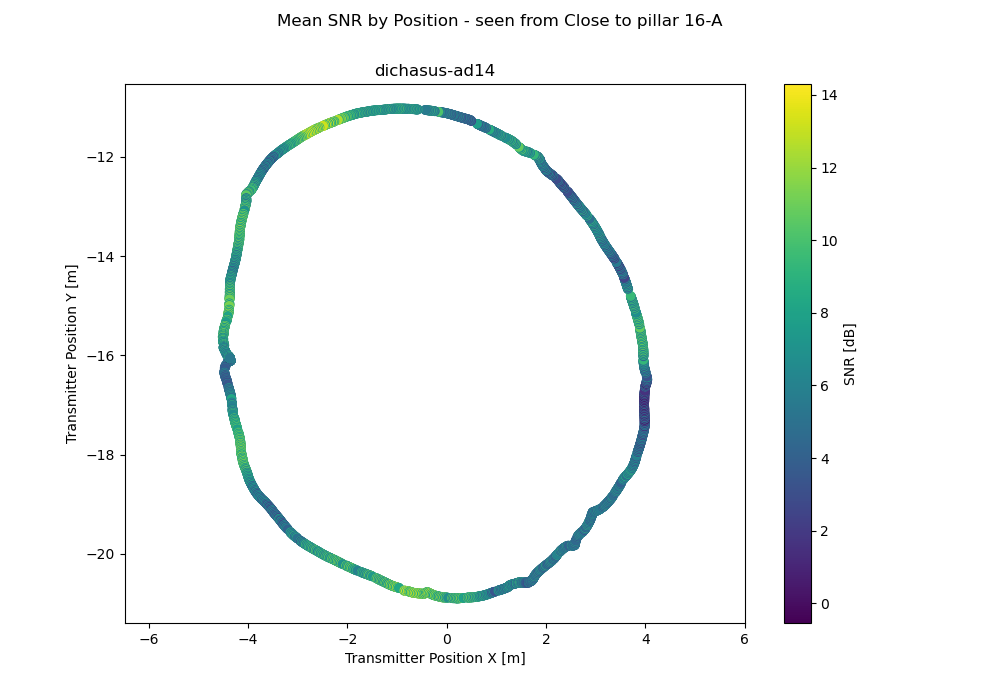
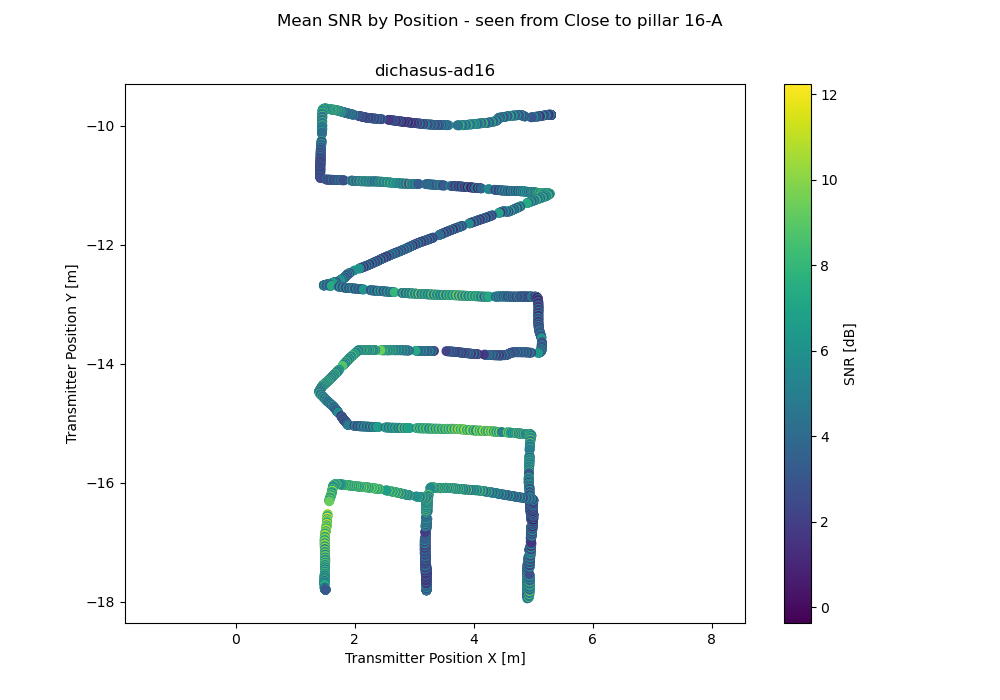
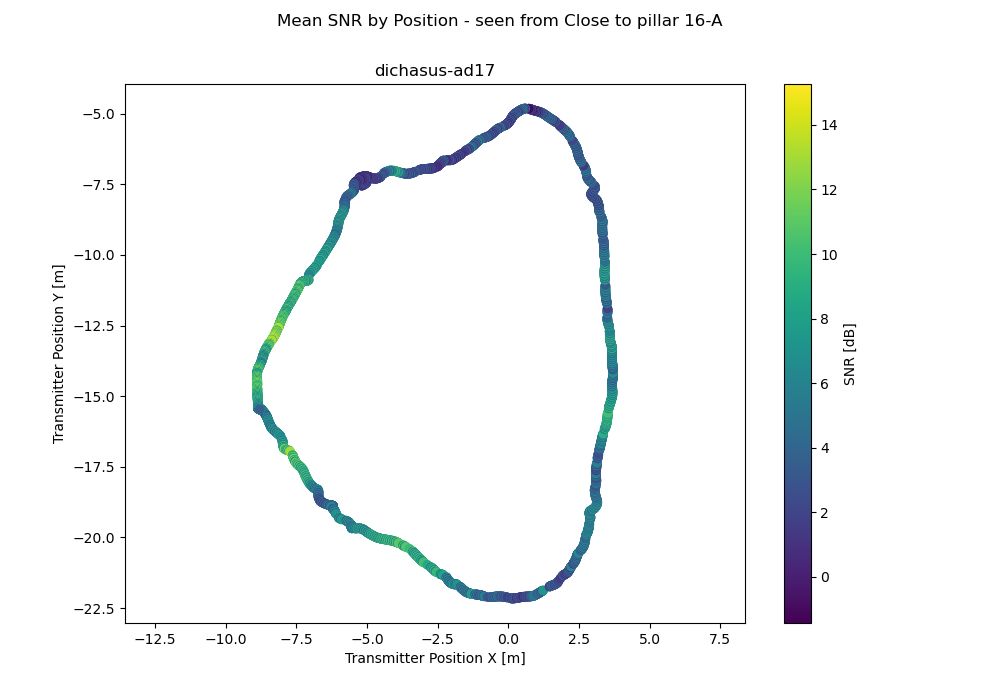
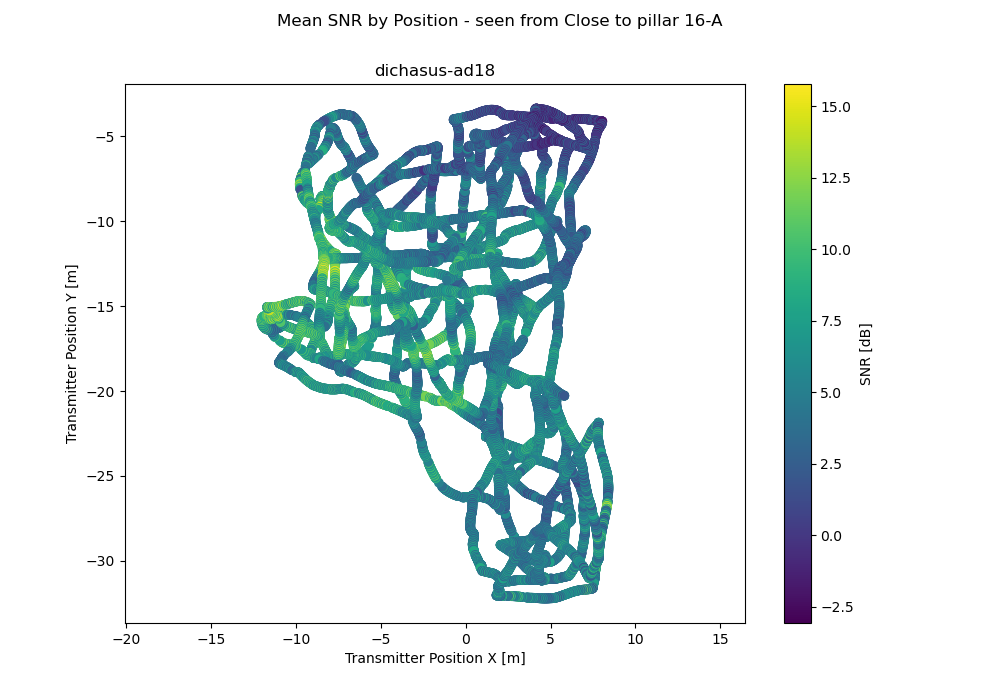
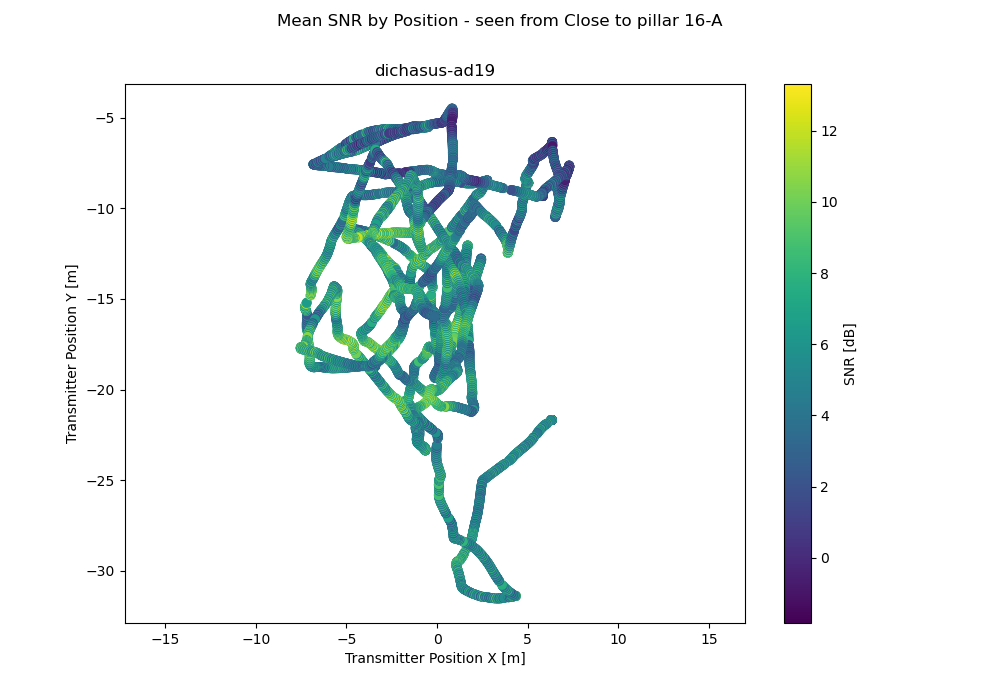
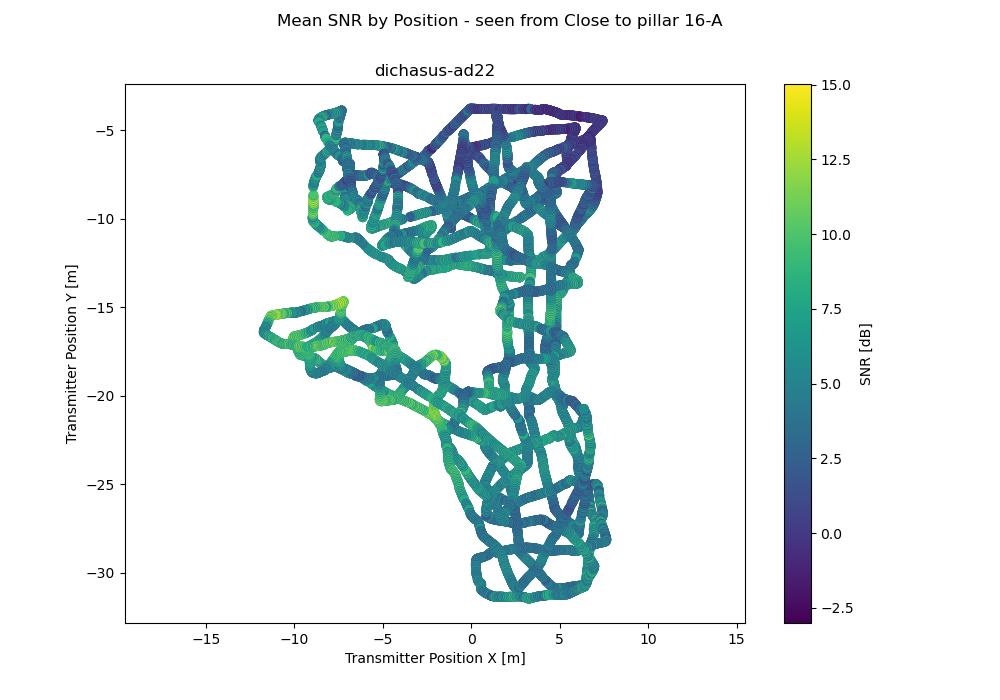
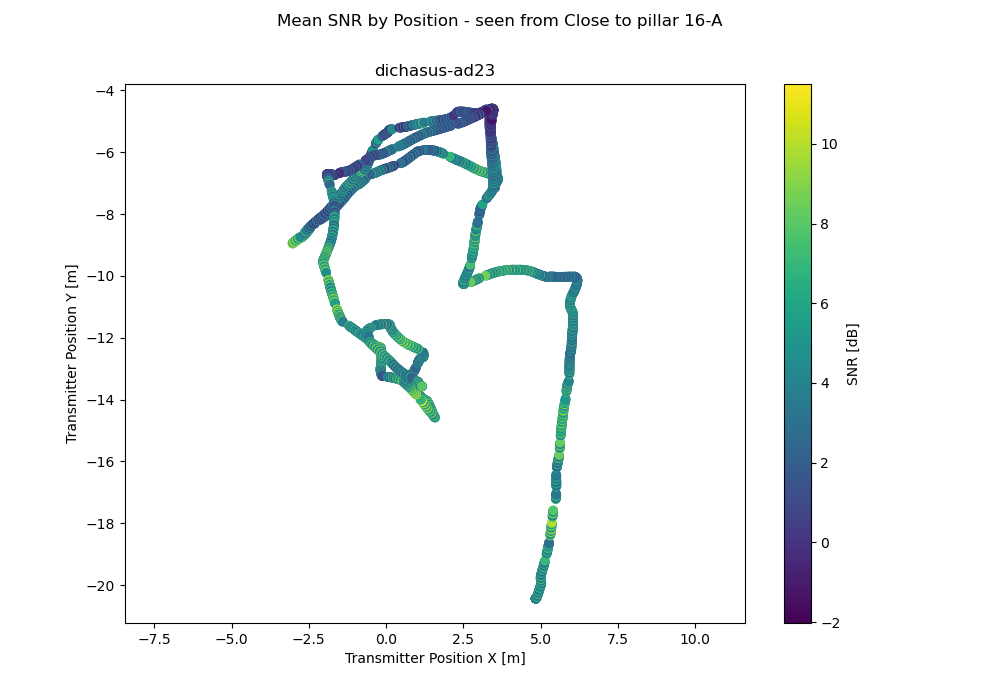
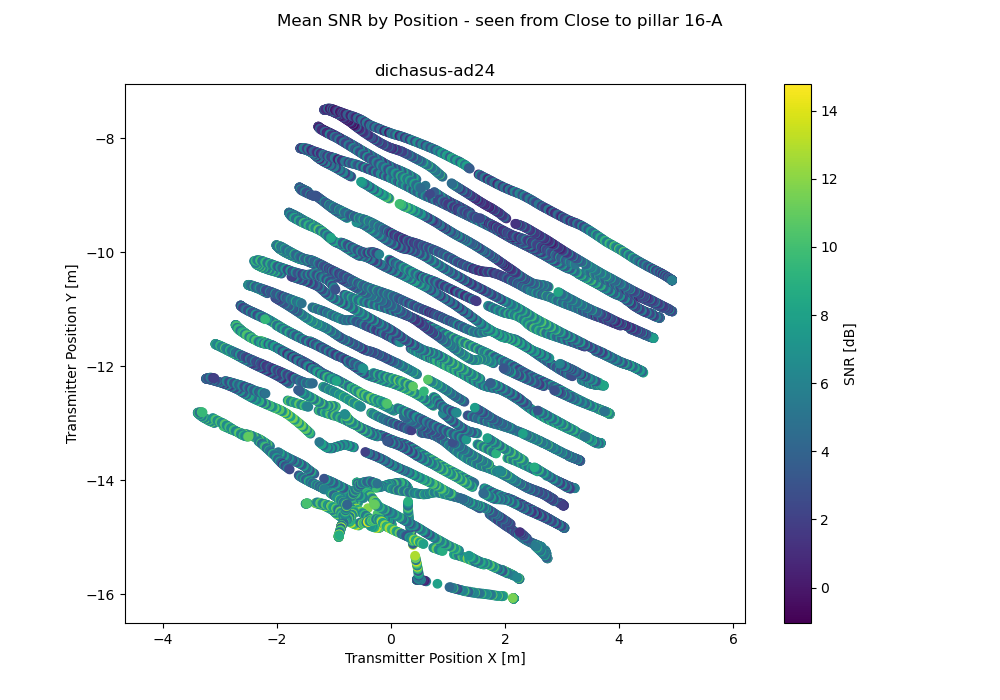
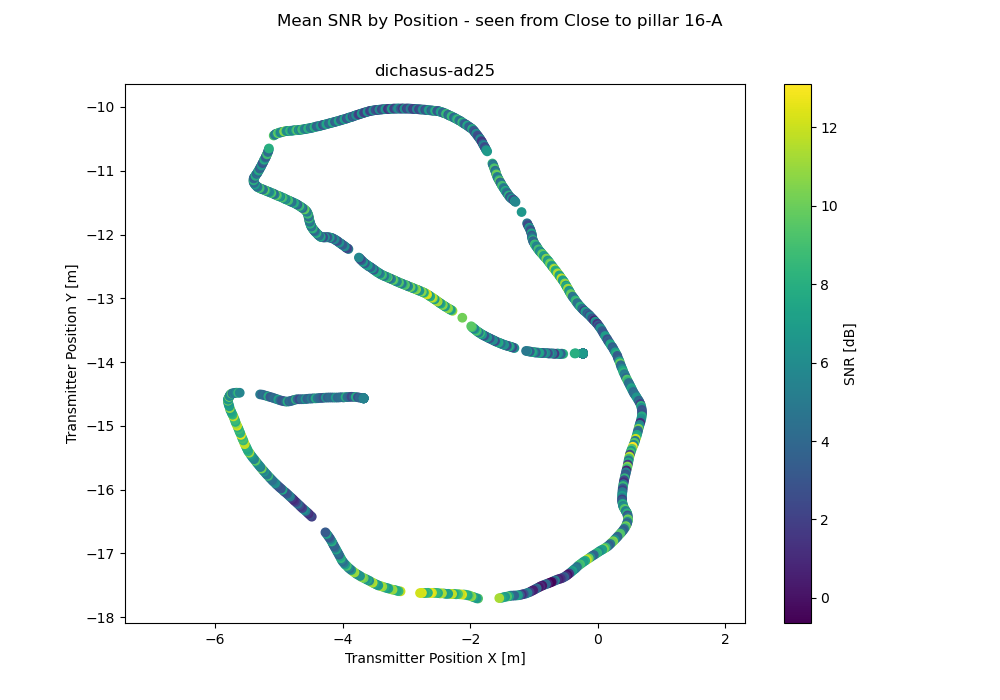
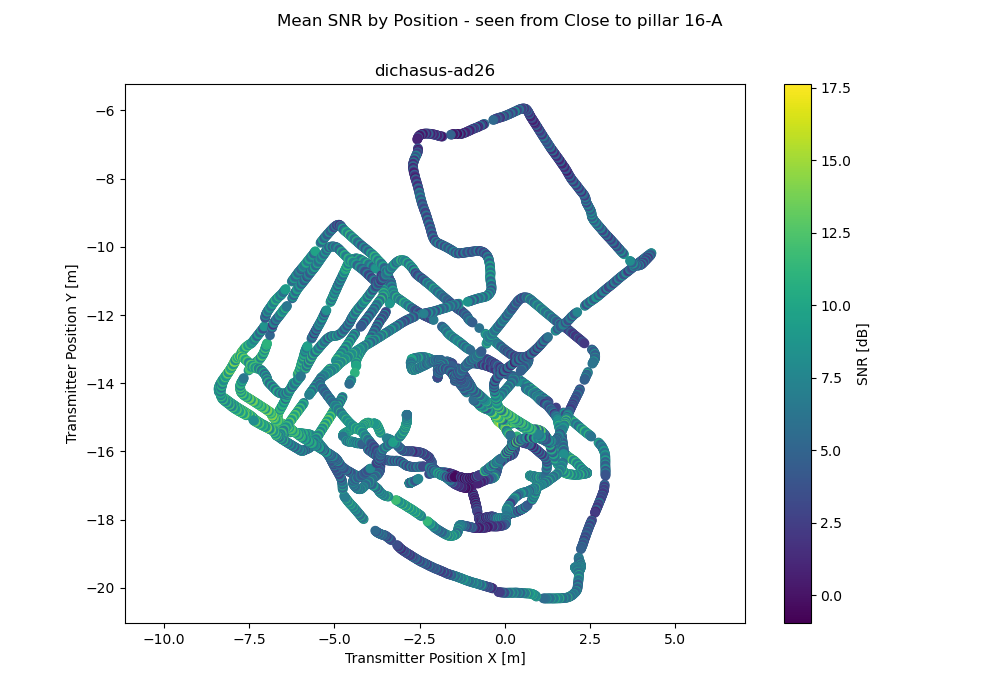
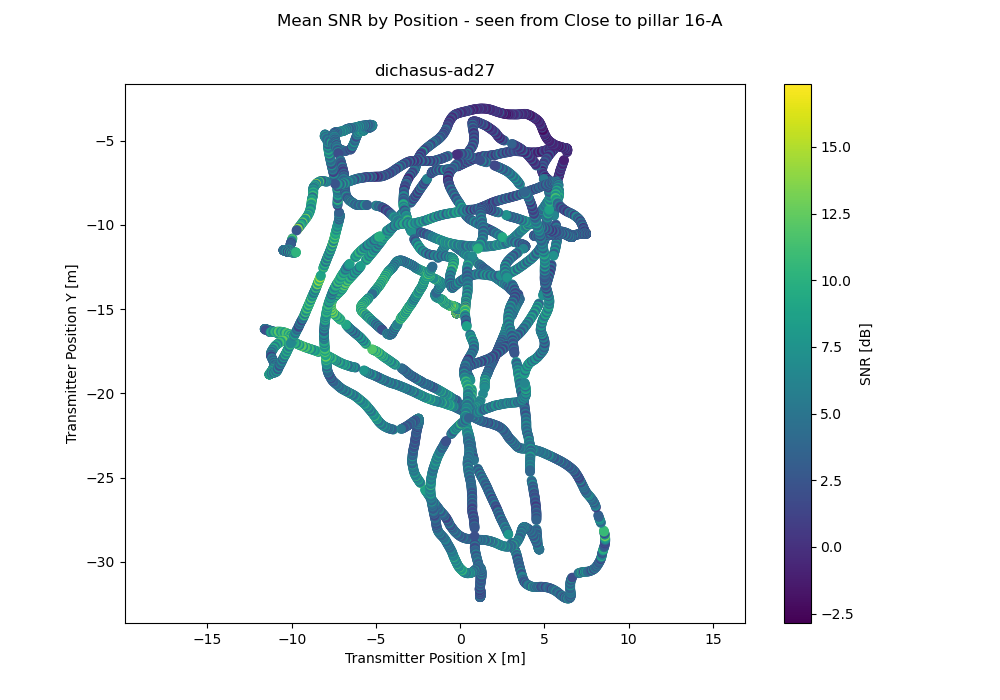
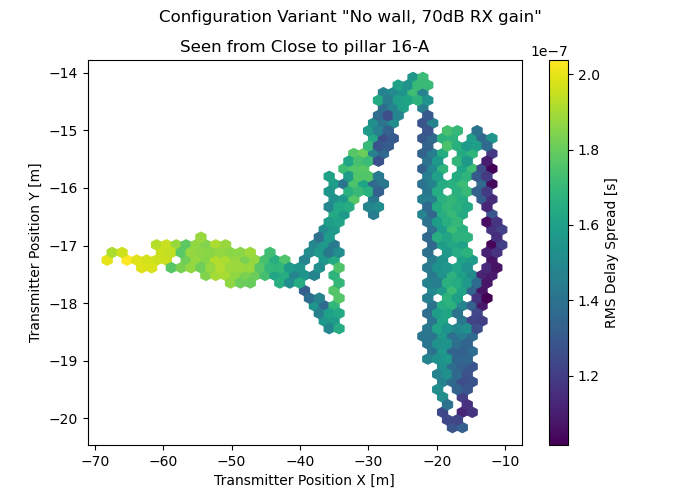
Antenna 2: Close to pillar 16-A
| 26 | 35 | 59 | 53 | 19 | 20 | 17 | 54 |
| 1 | 48 | 61 | 44 | 5 | 49 | 6 | 60 |
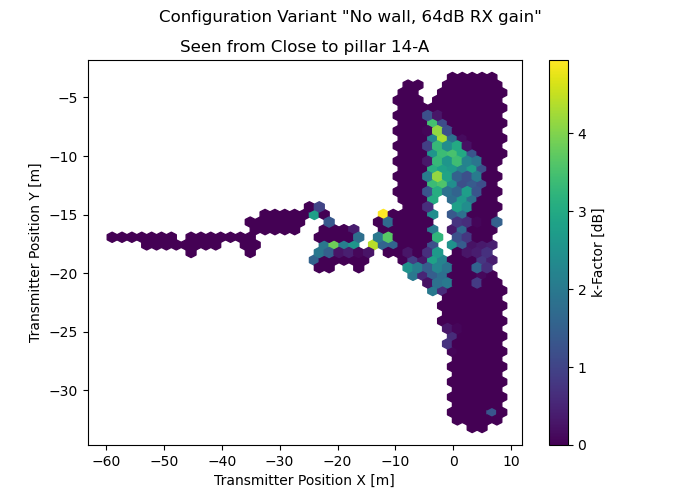
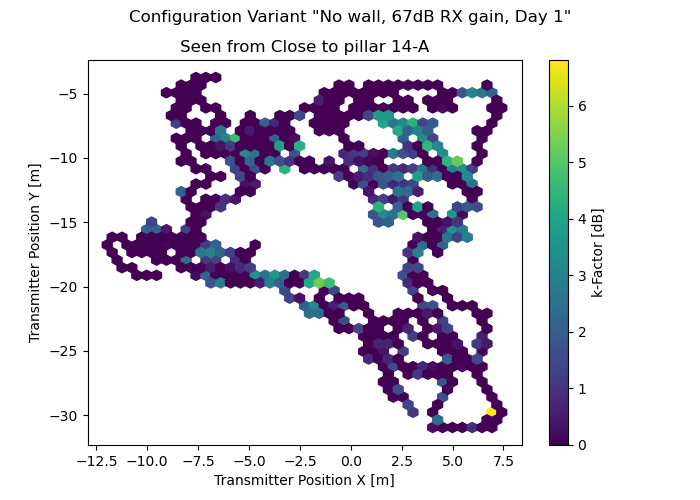
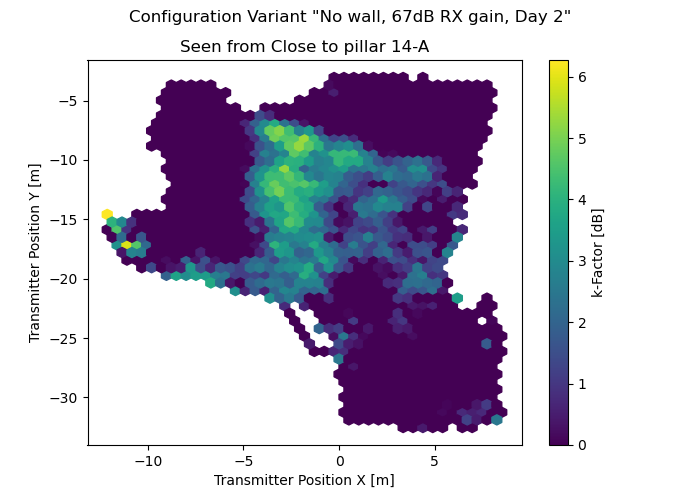
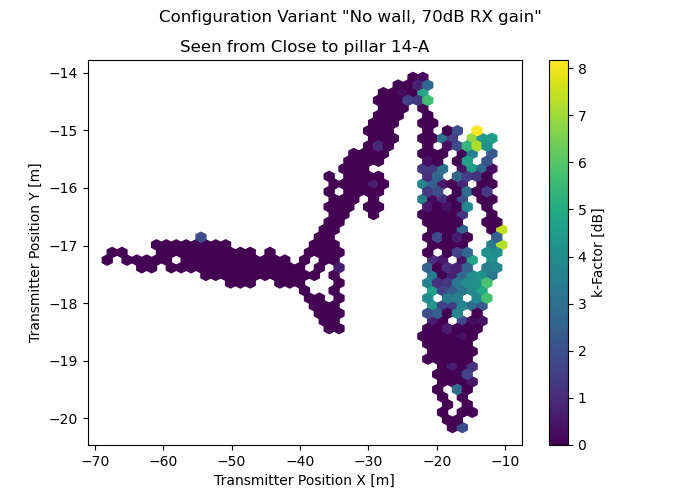
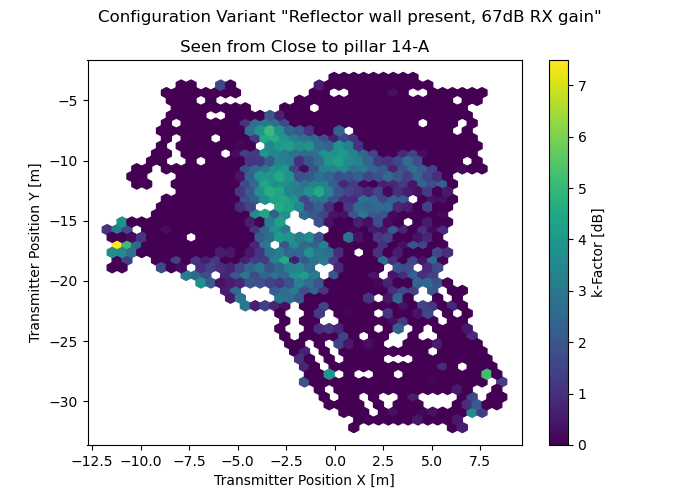
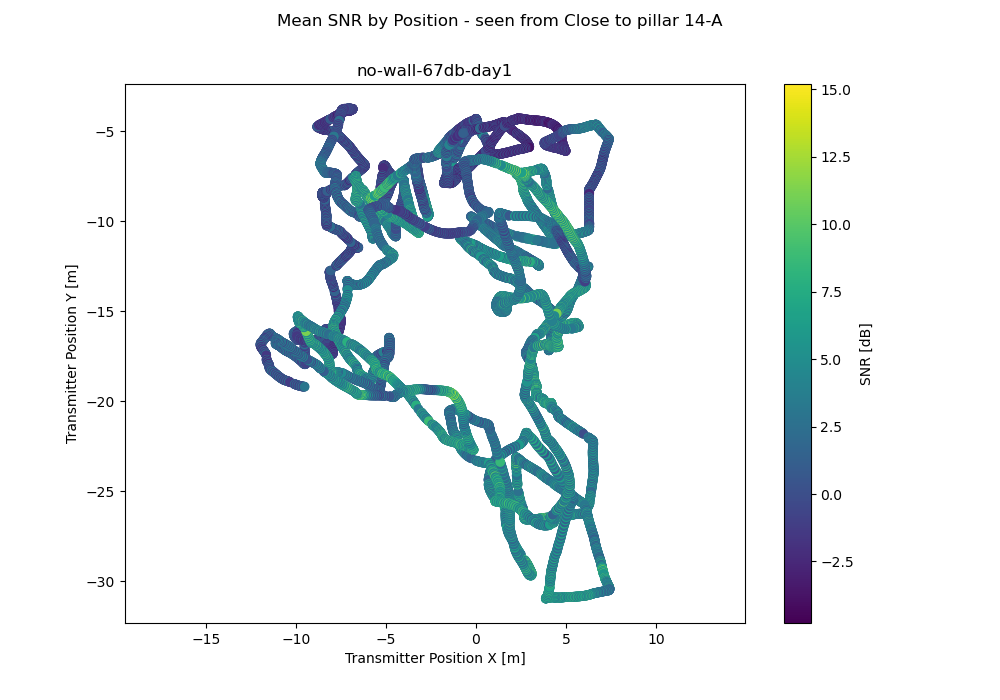
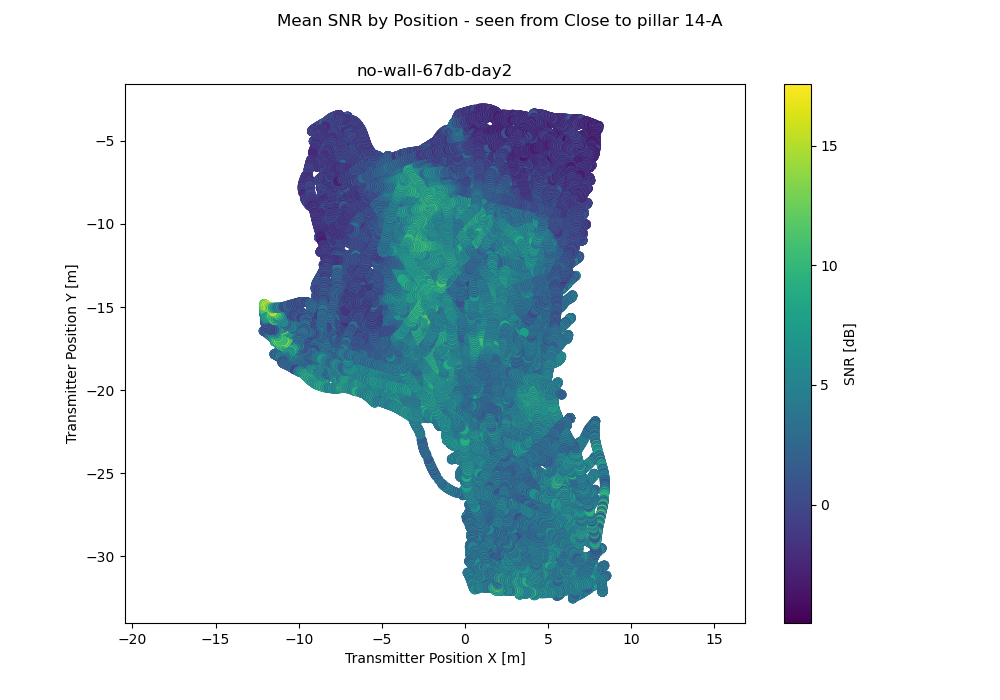
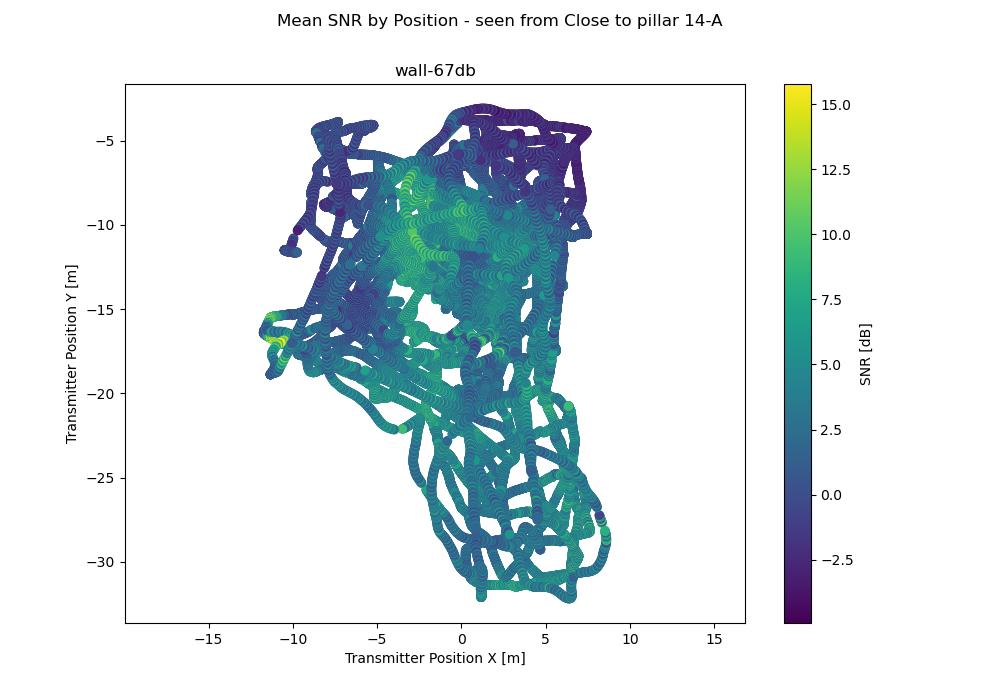
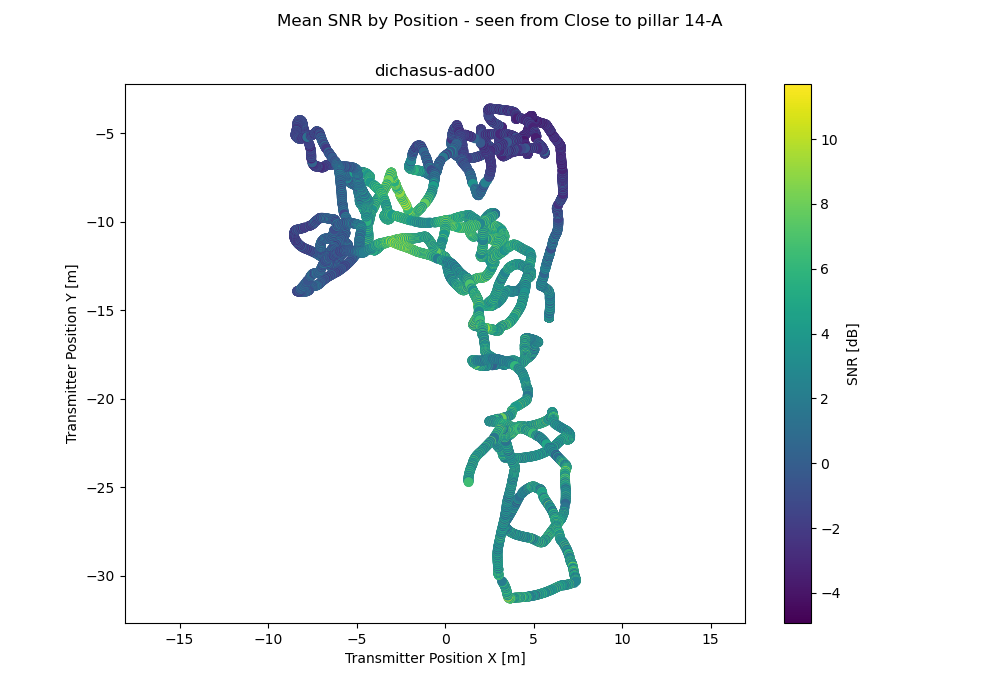
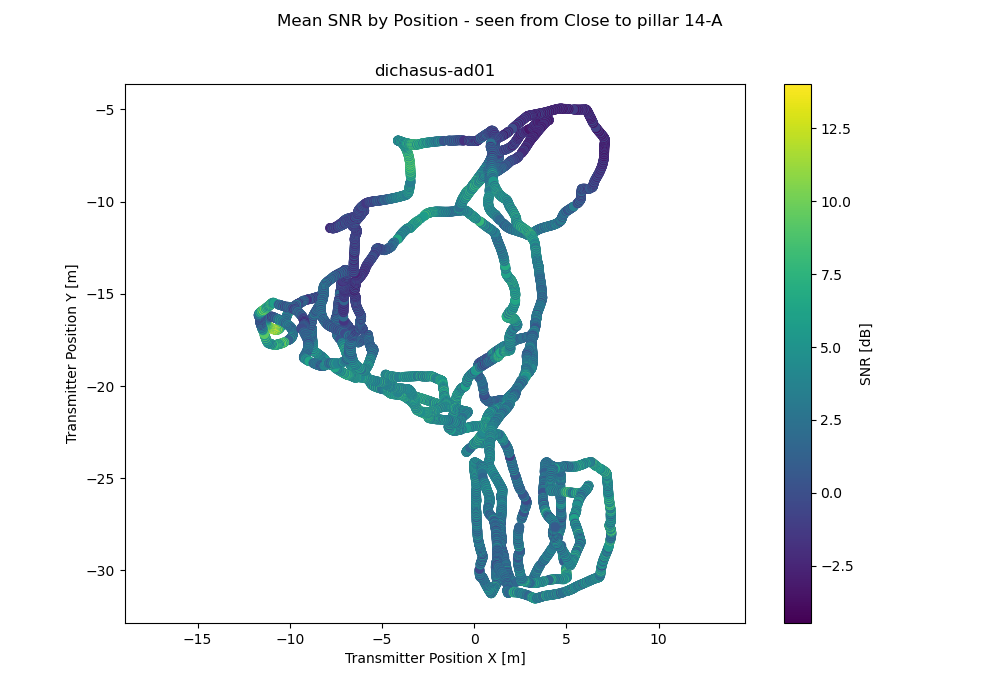
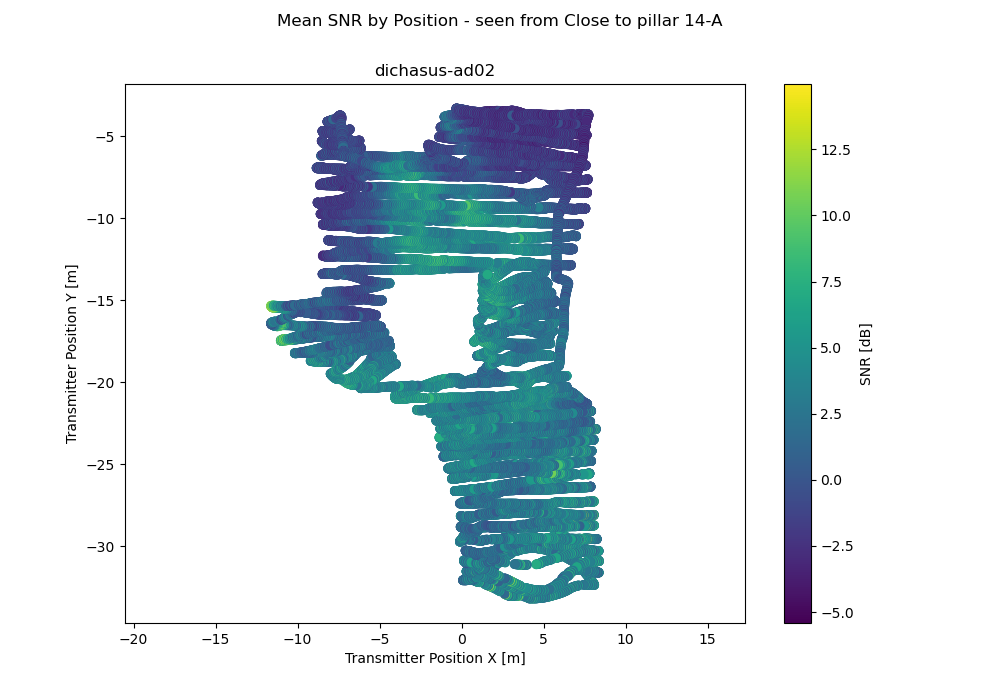
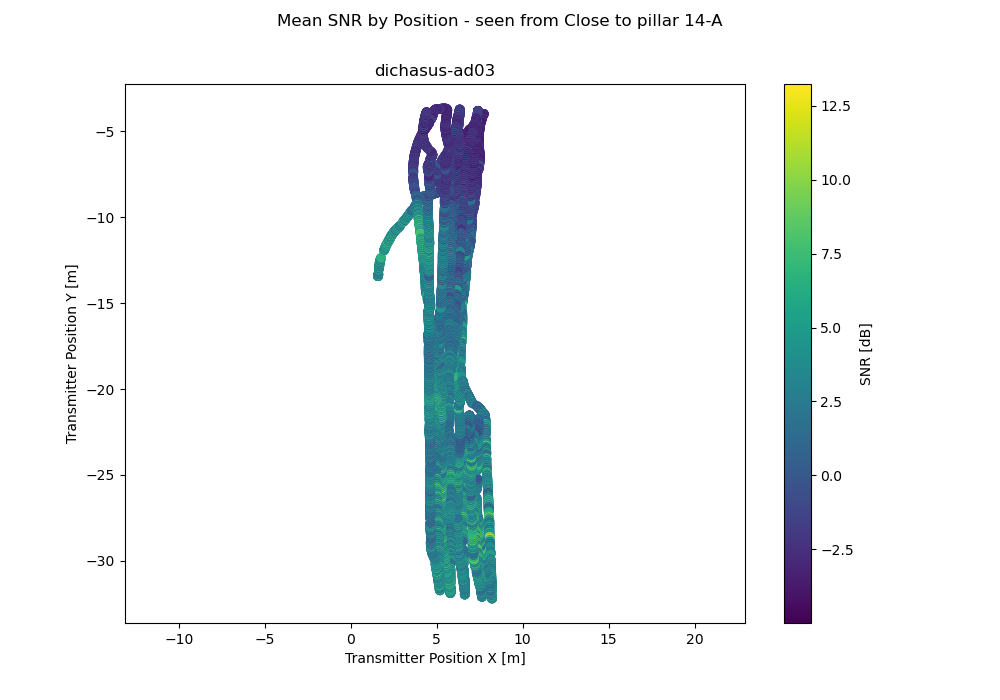
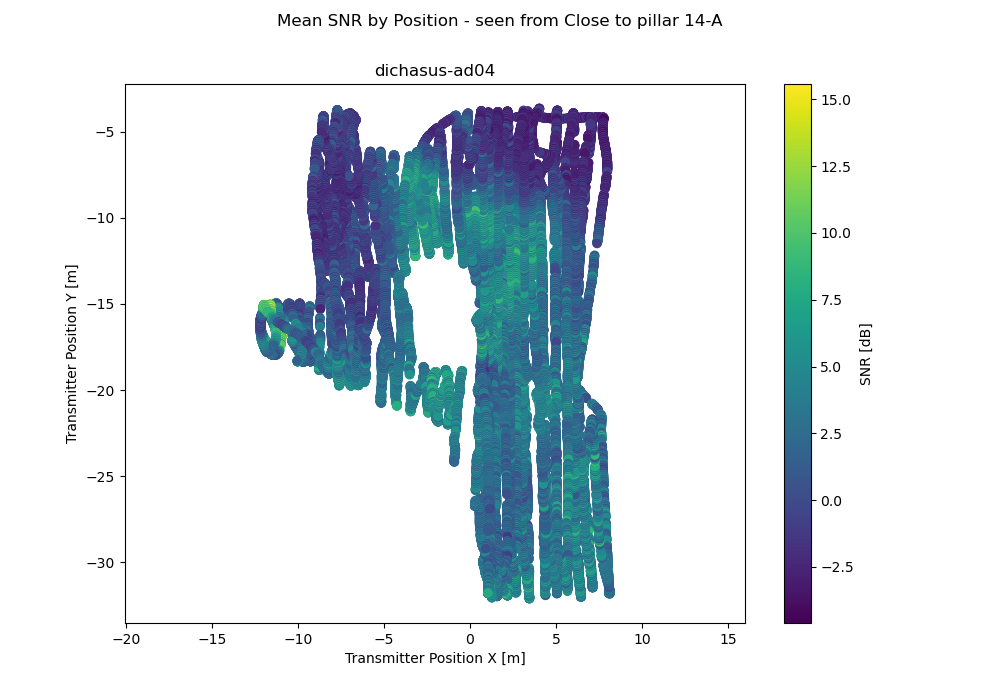
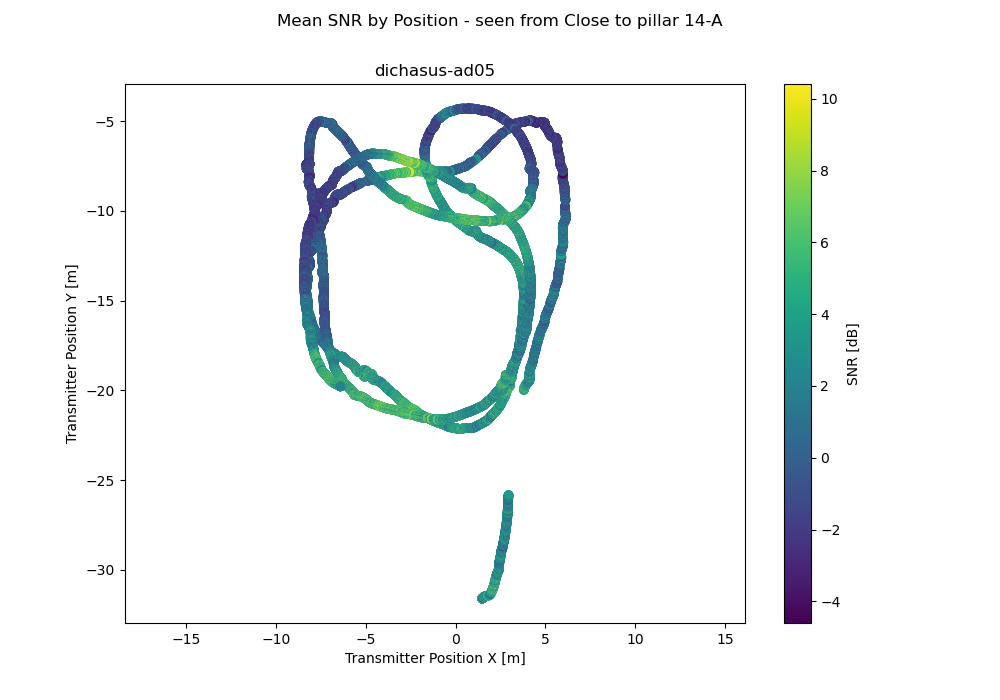
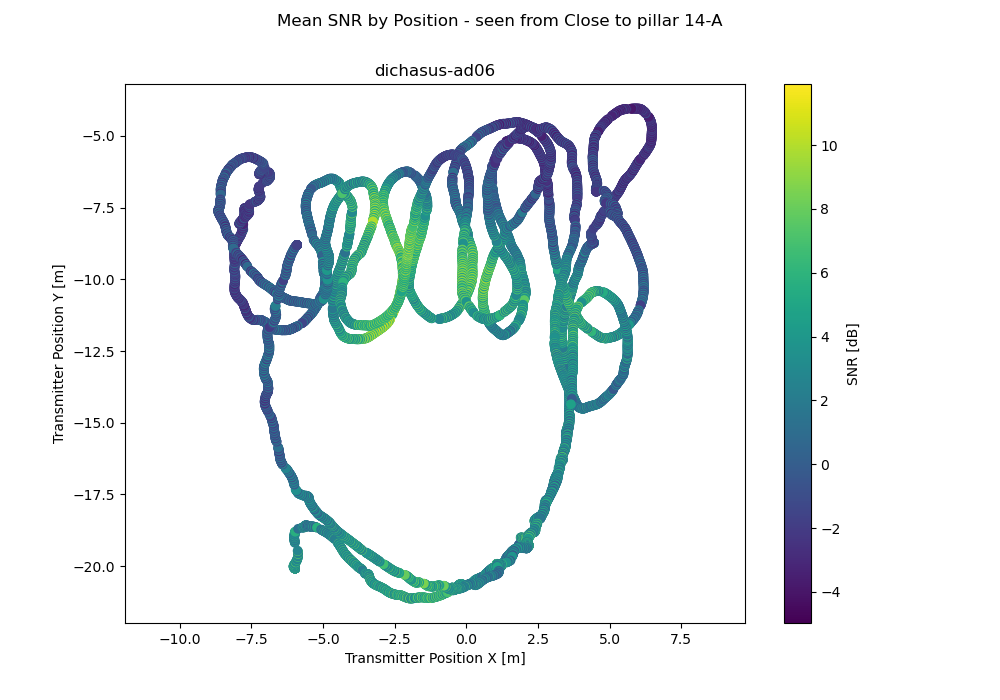
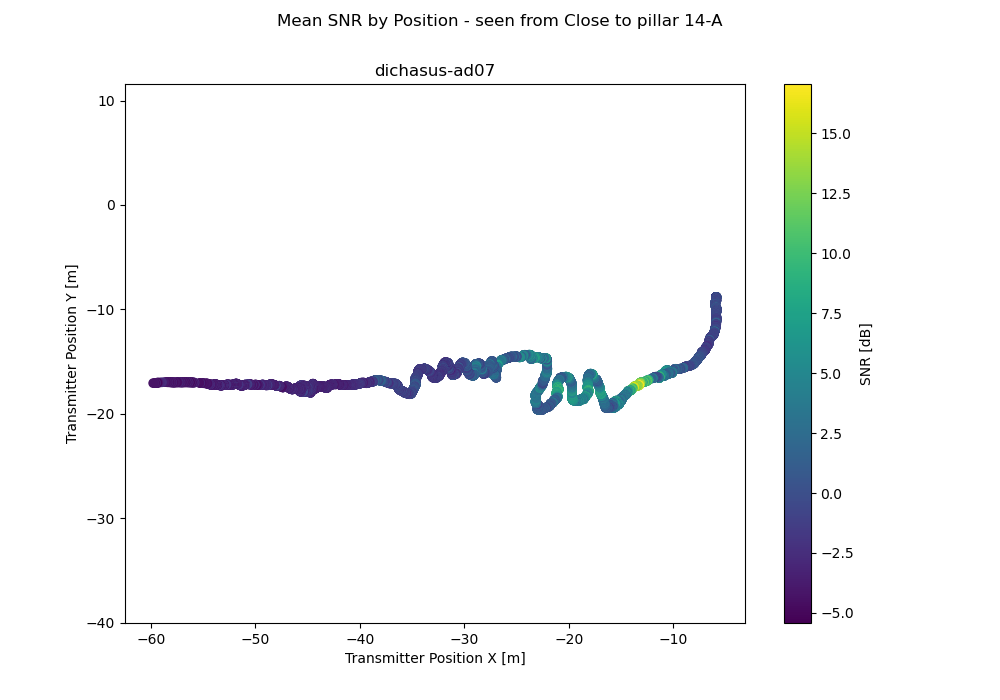
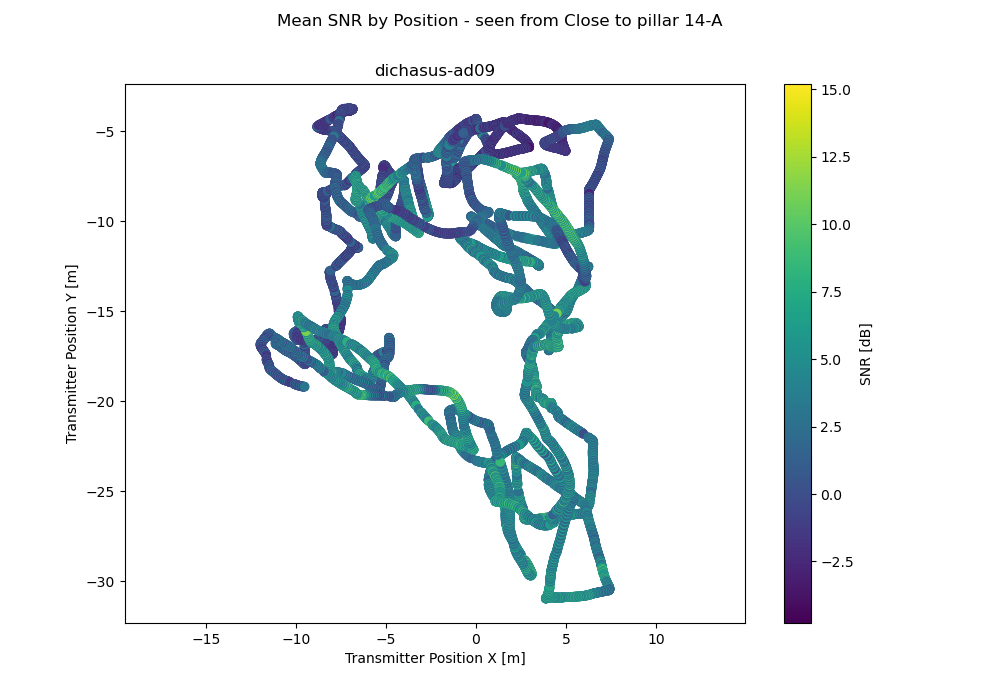
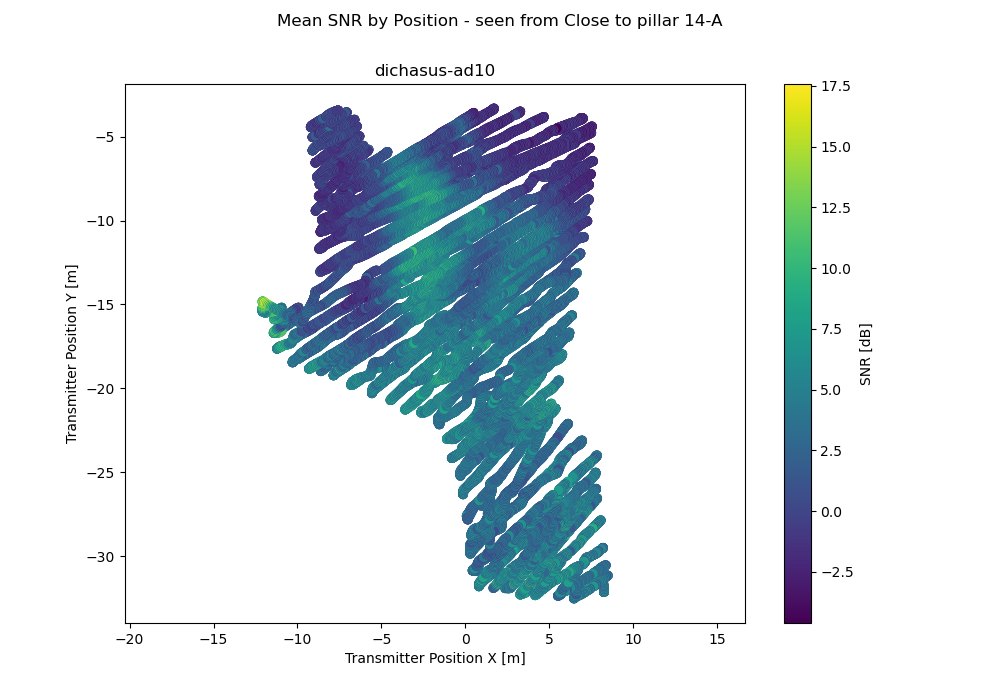
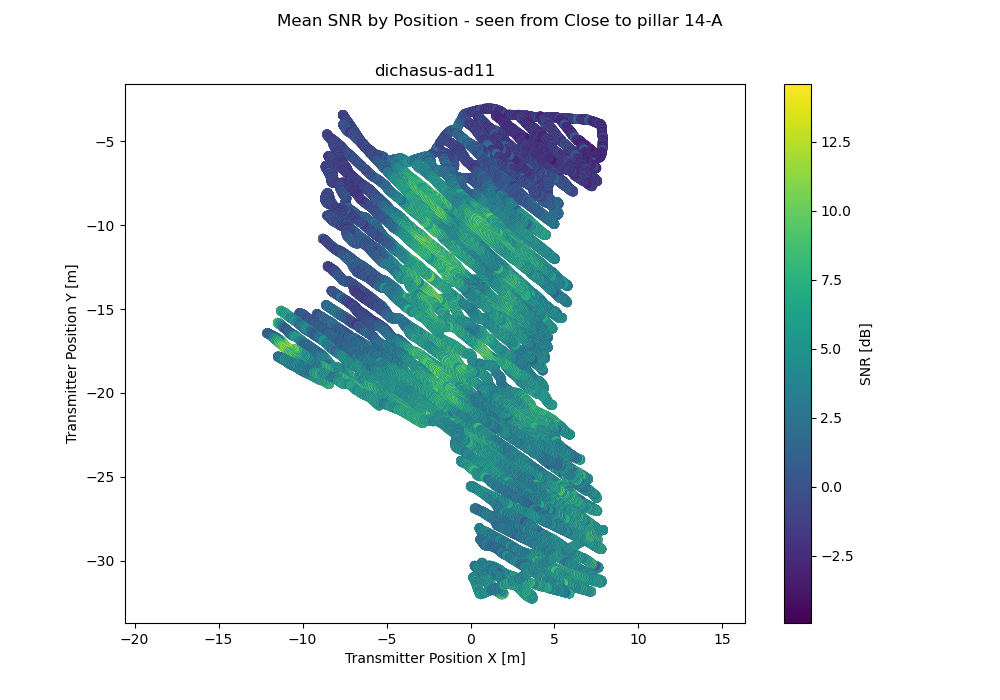
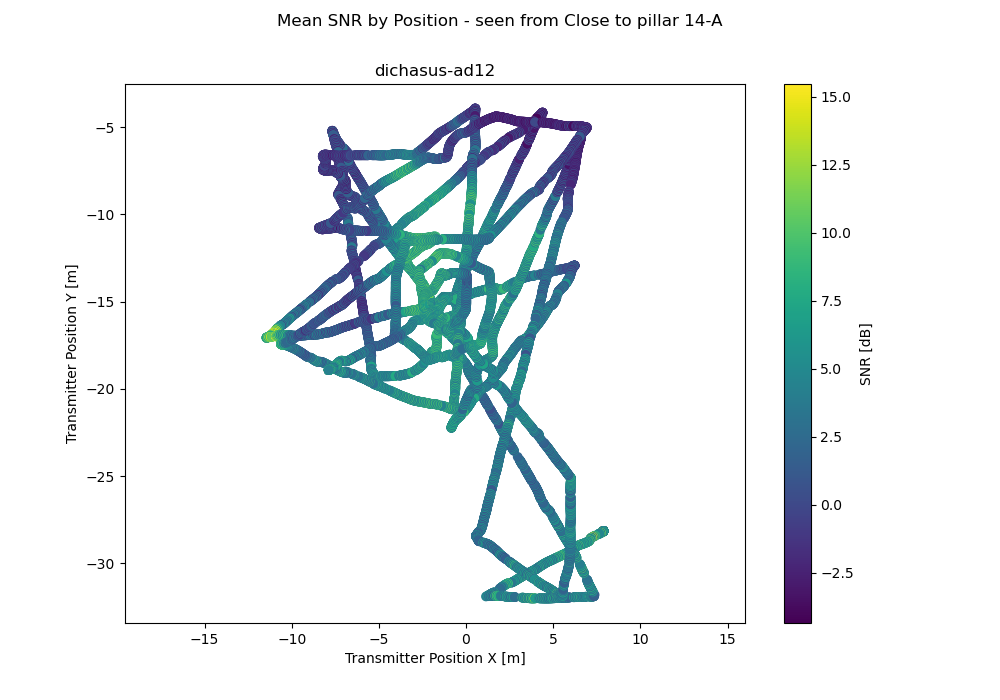
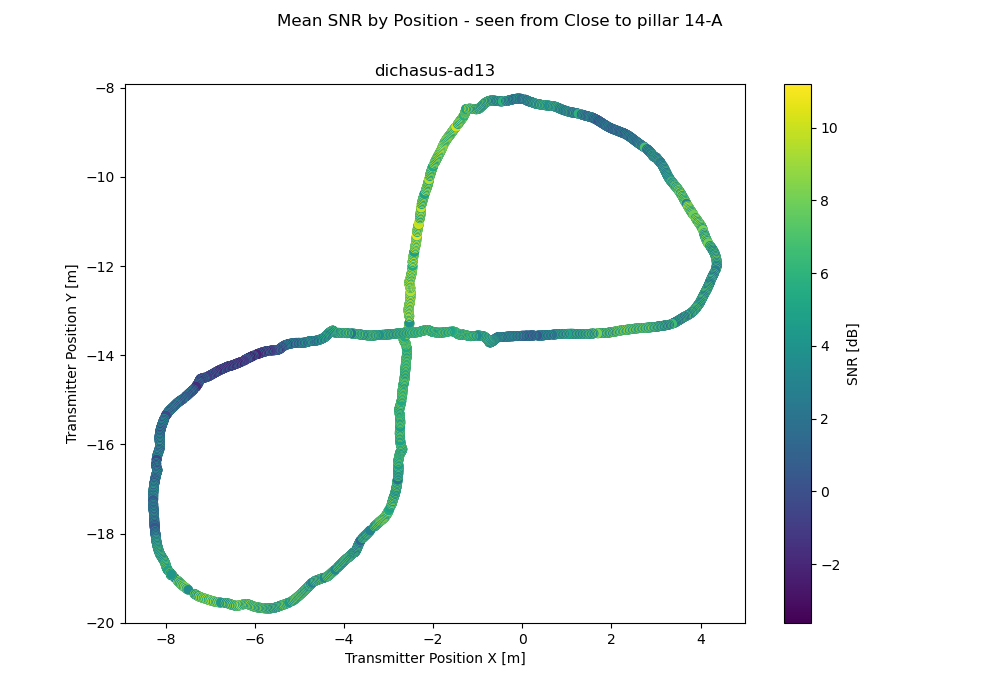
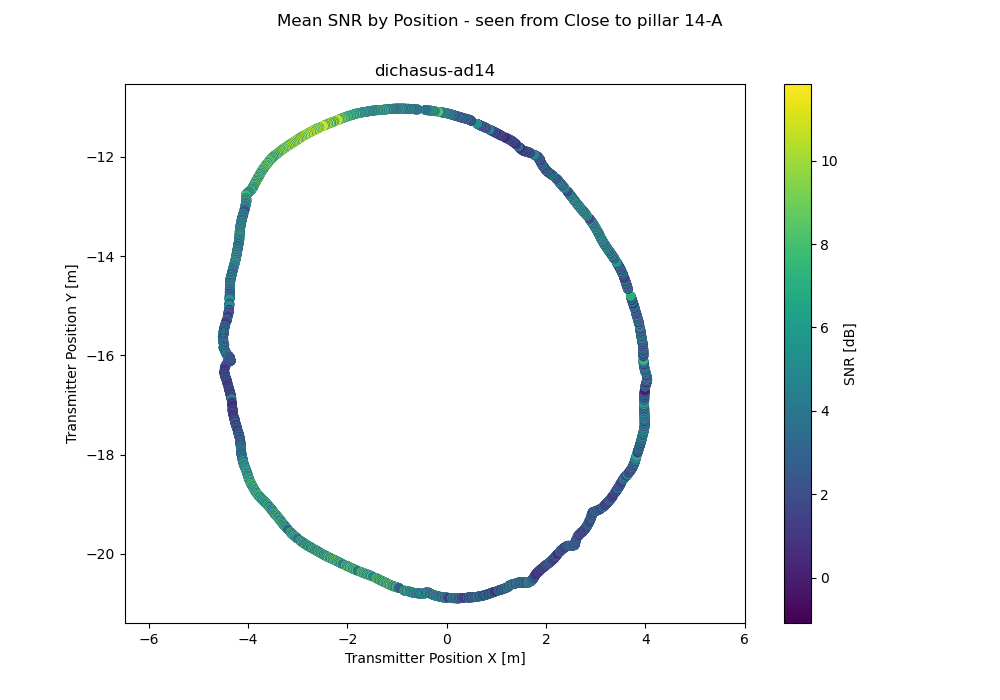
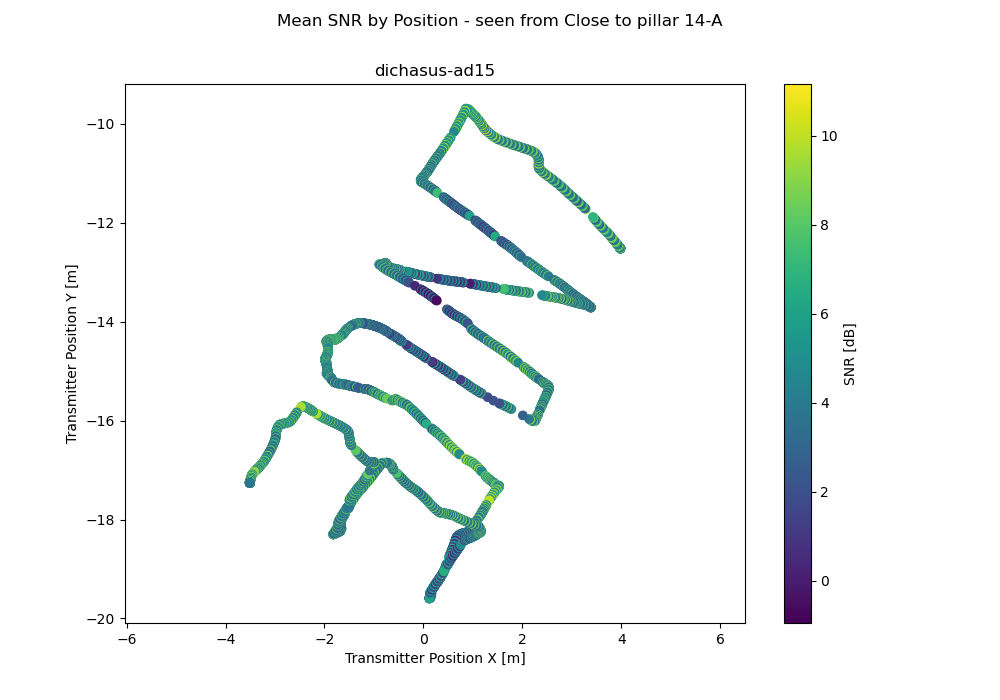
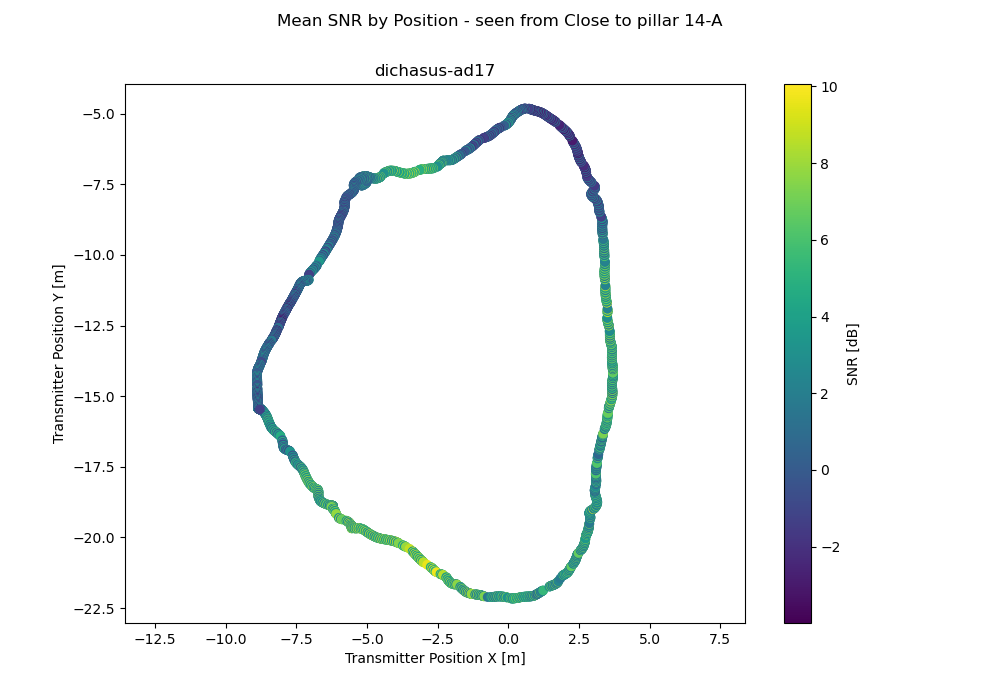
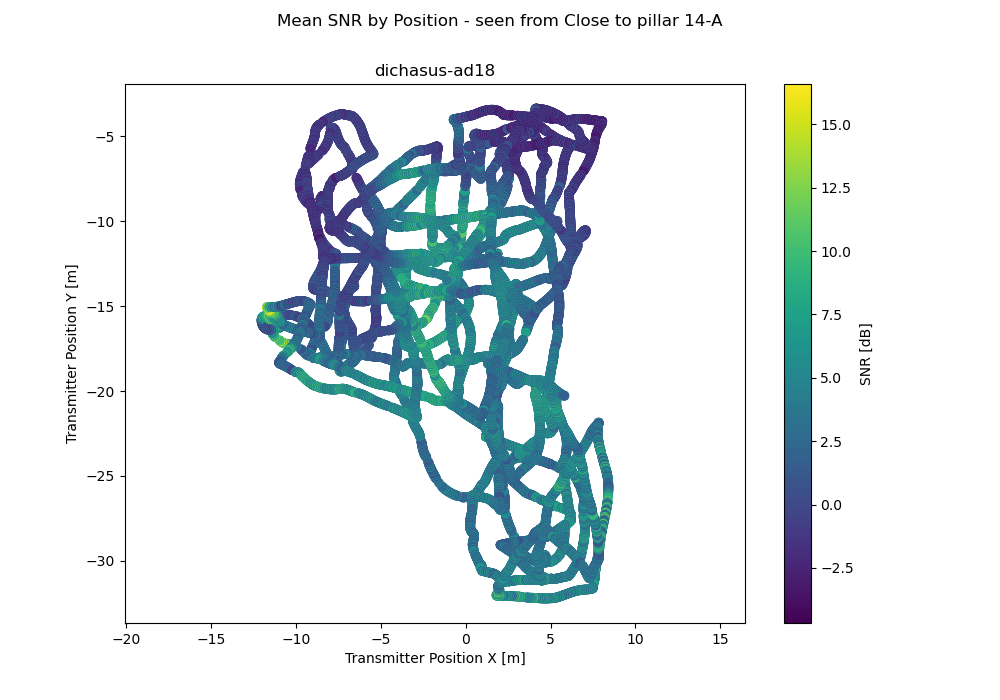
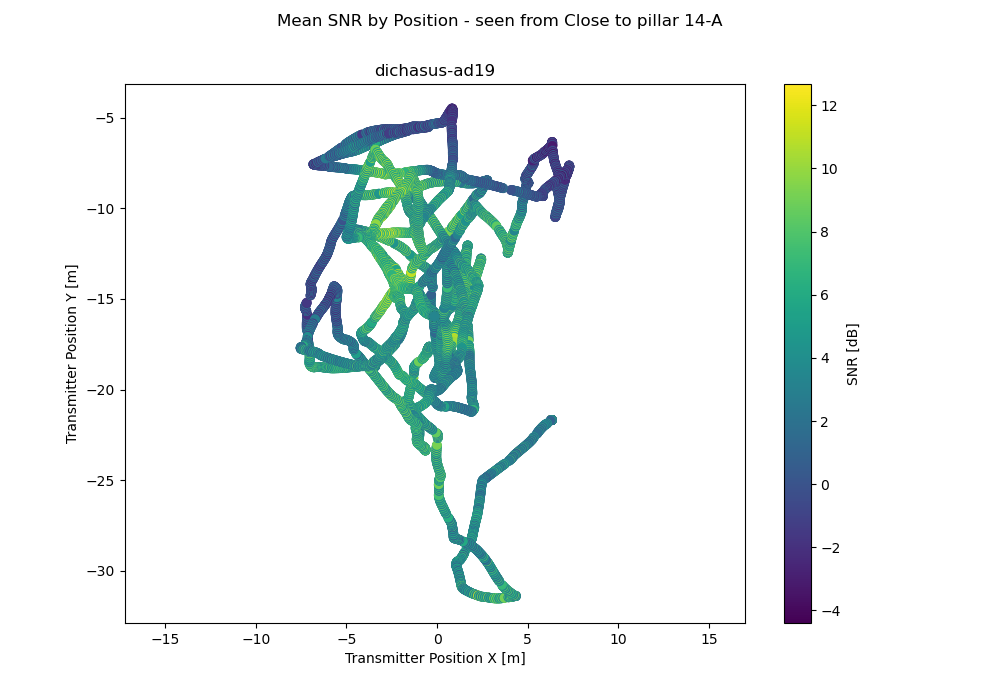
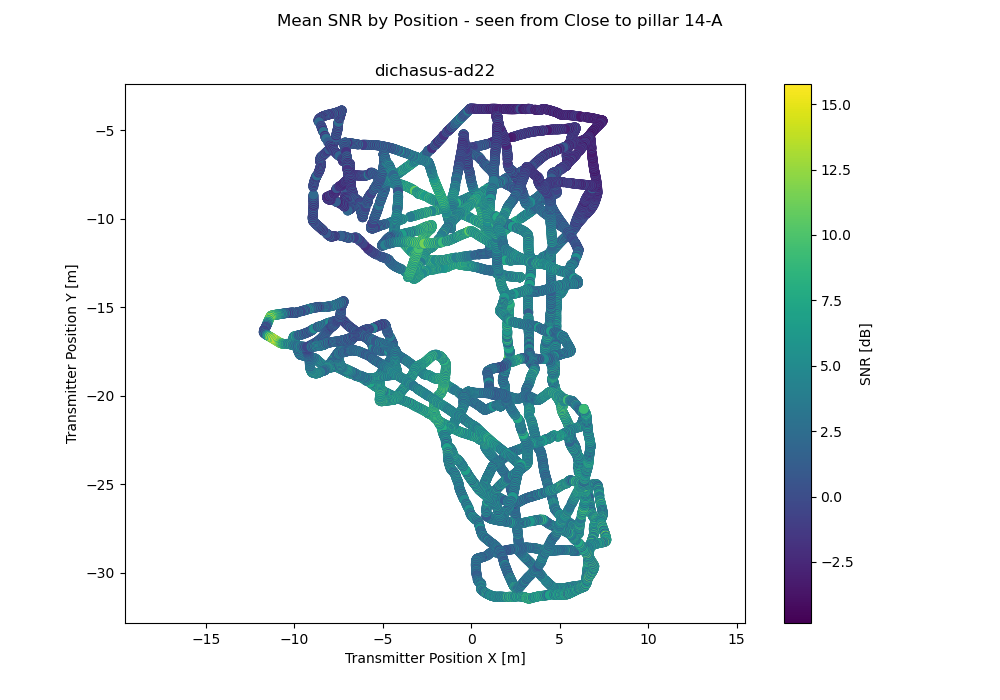
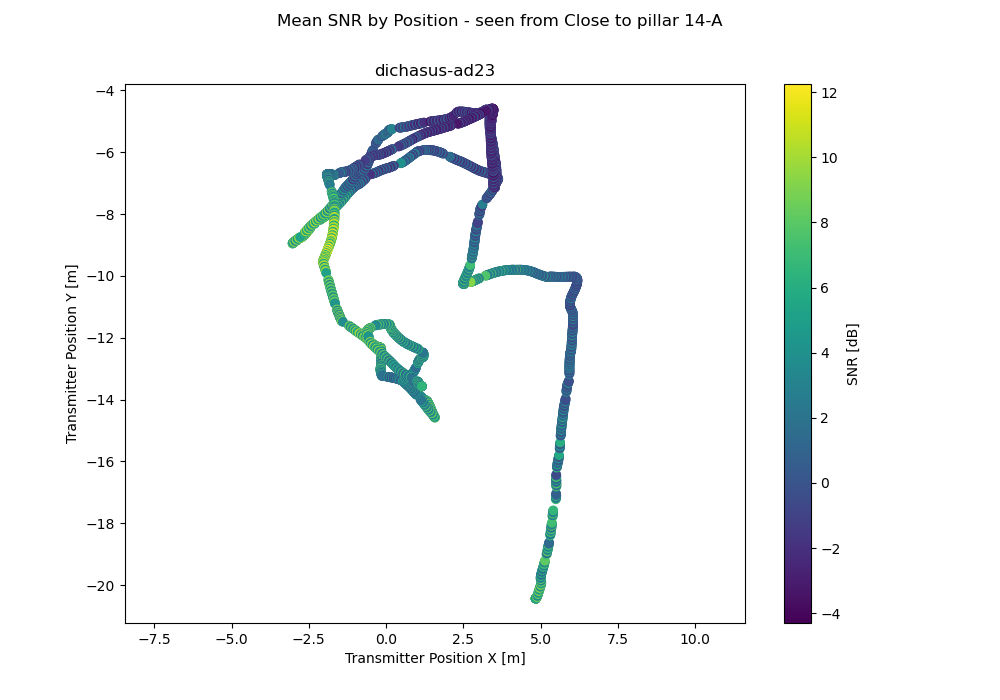
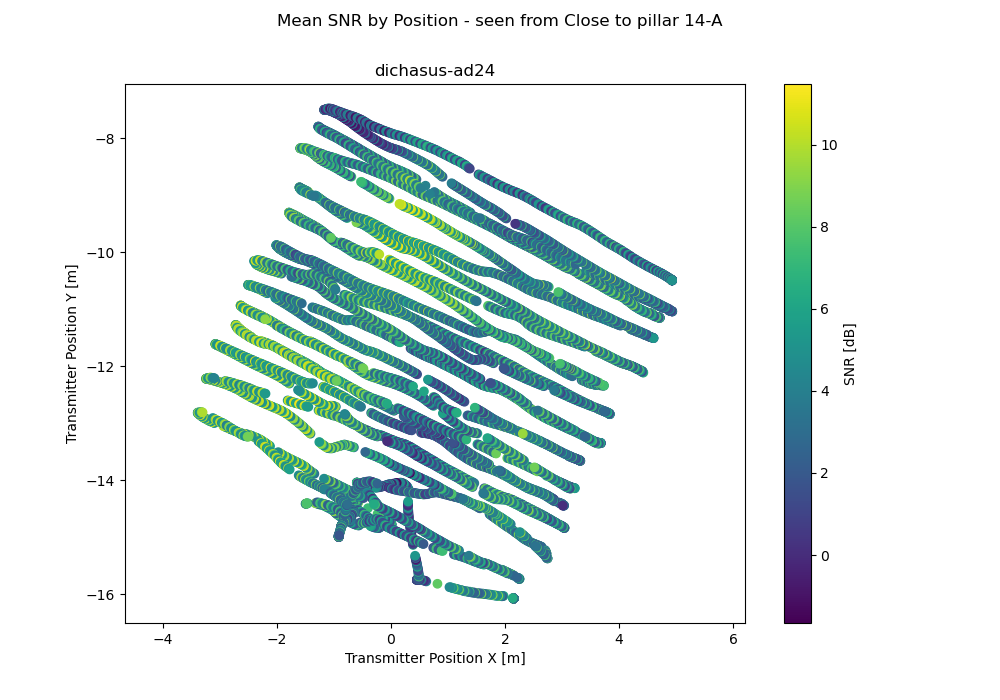
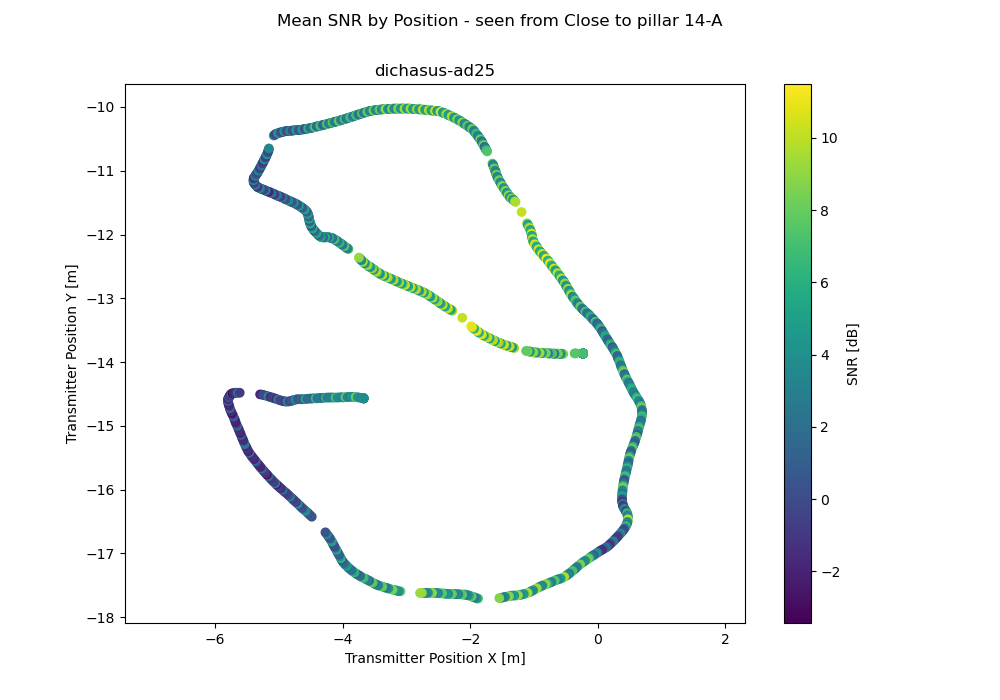
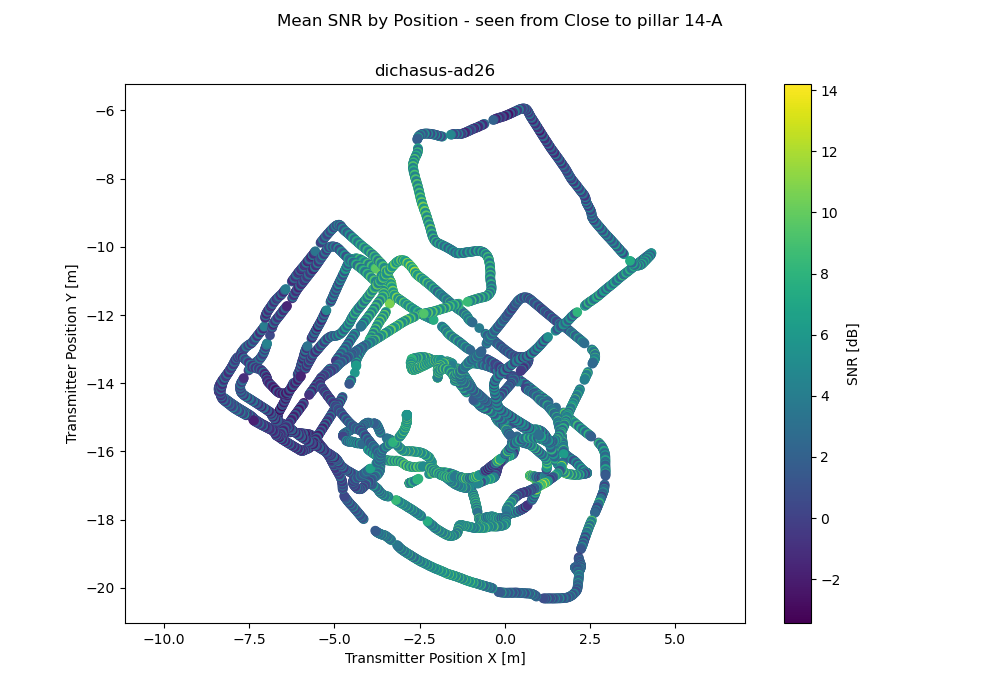
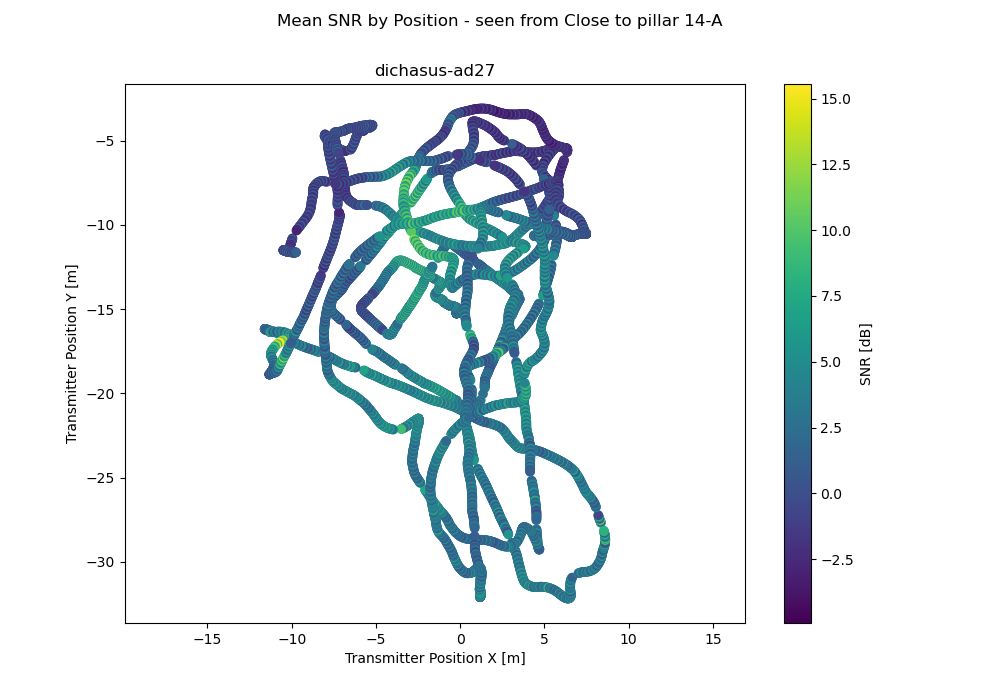
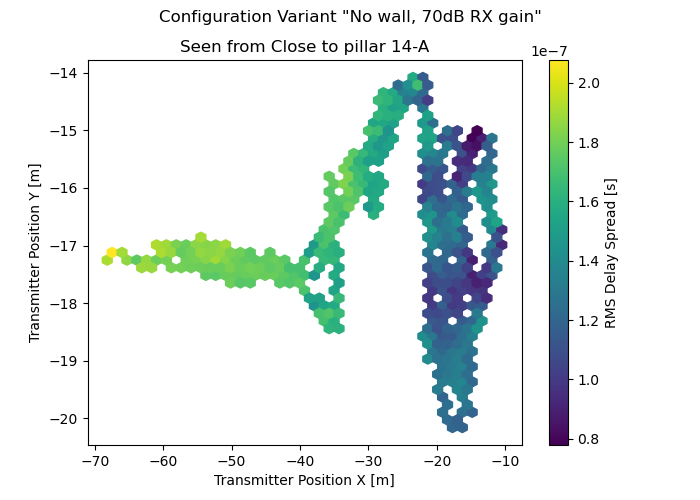
Antenna 3: Close to pillar 14-A
| 31 | 15 | 4 | 14 | 30 | 47 | 11 | 3 |
| 56 | 23 | 25 | 41 | 27 | 0 | 8 | 40 |
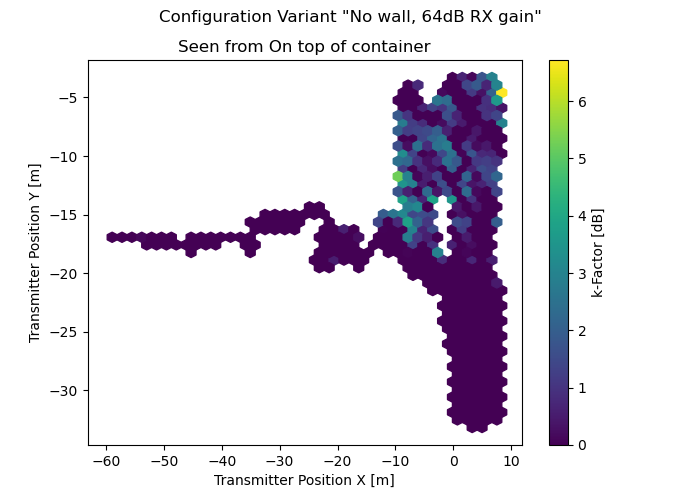
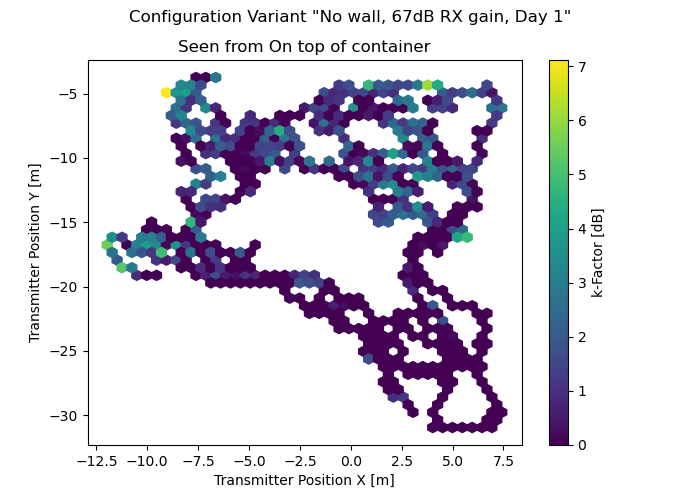
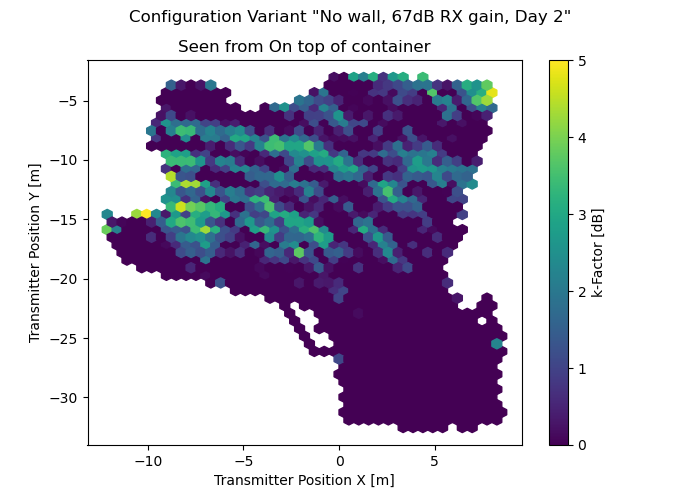
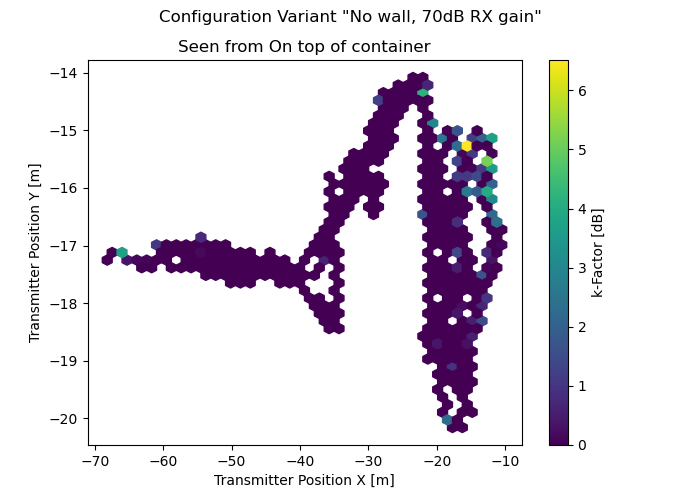
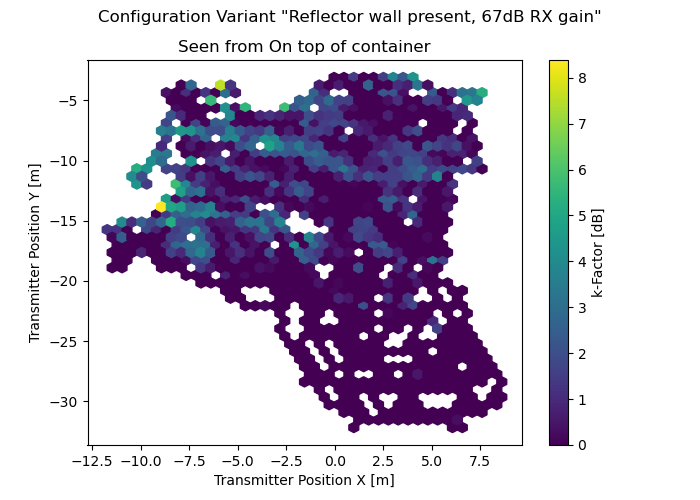
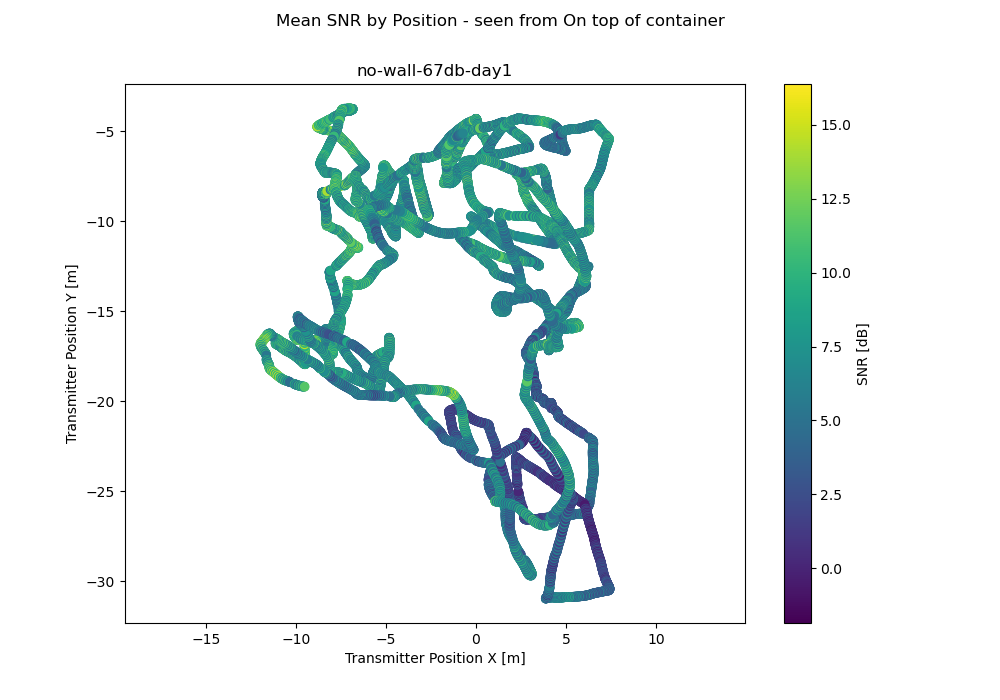
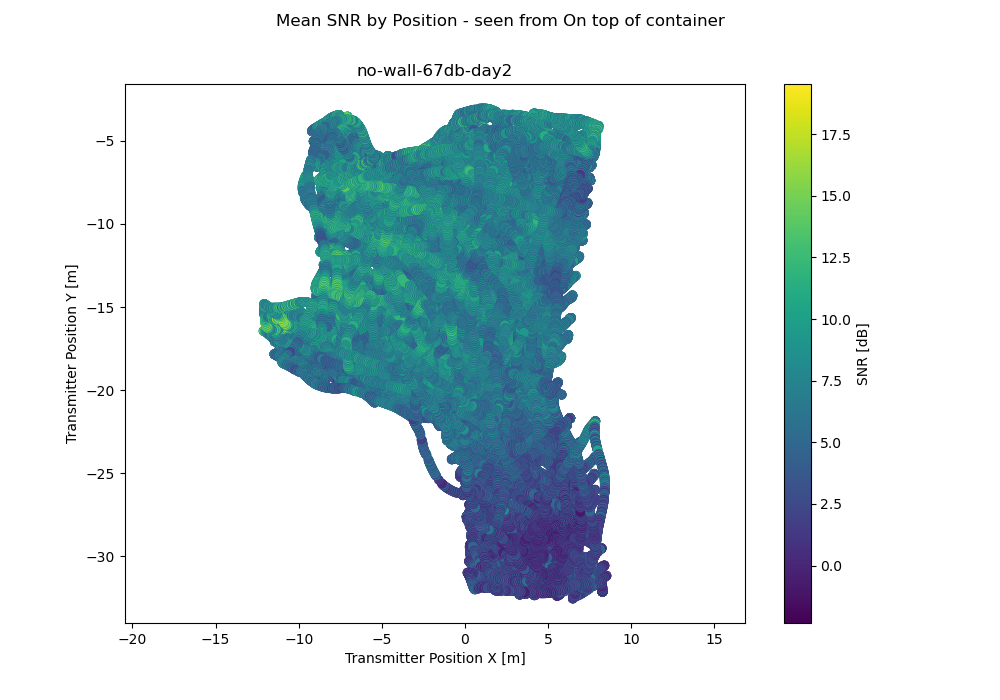
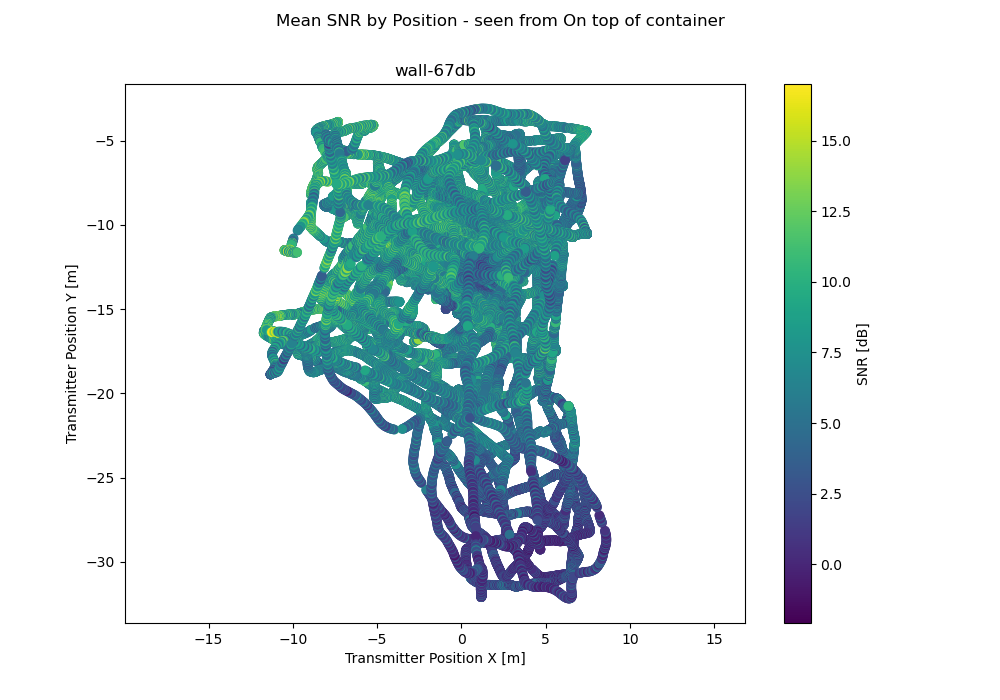
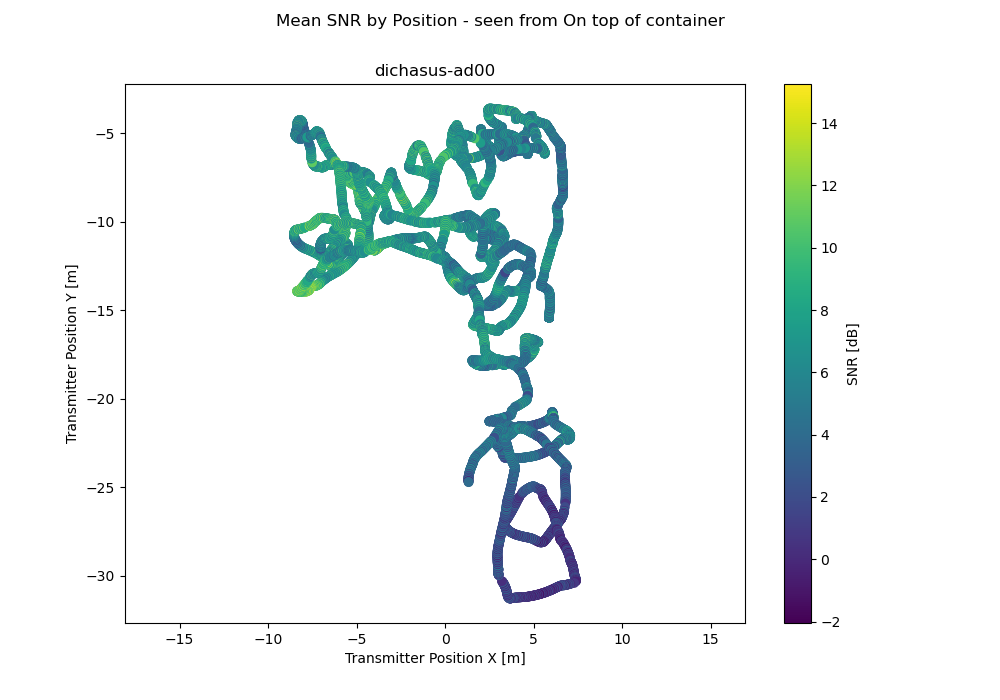
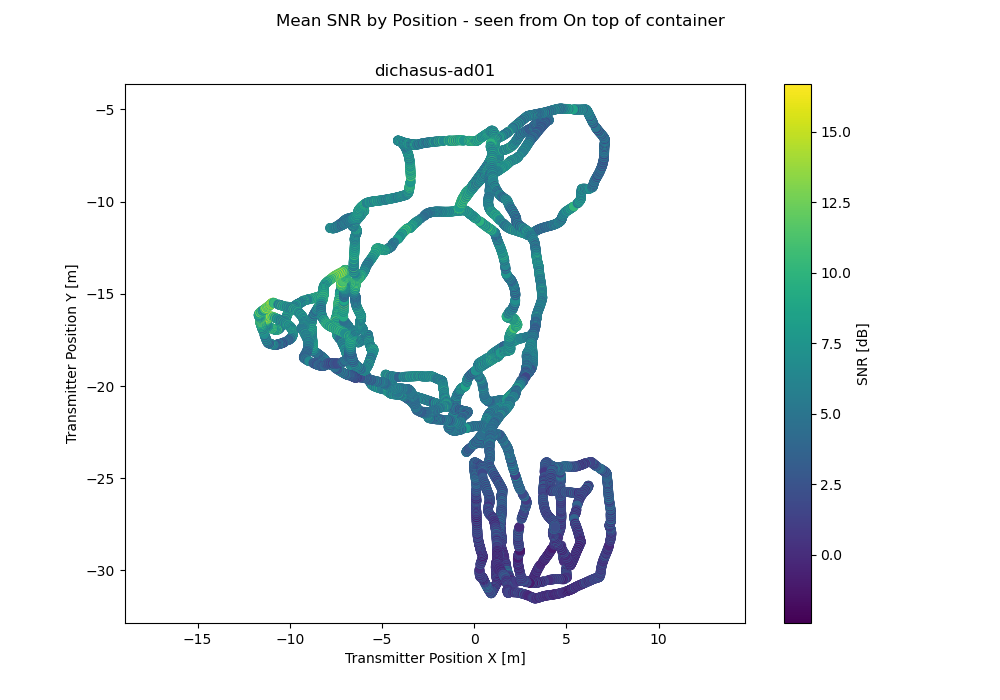
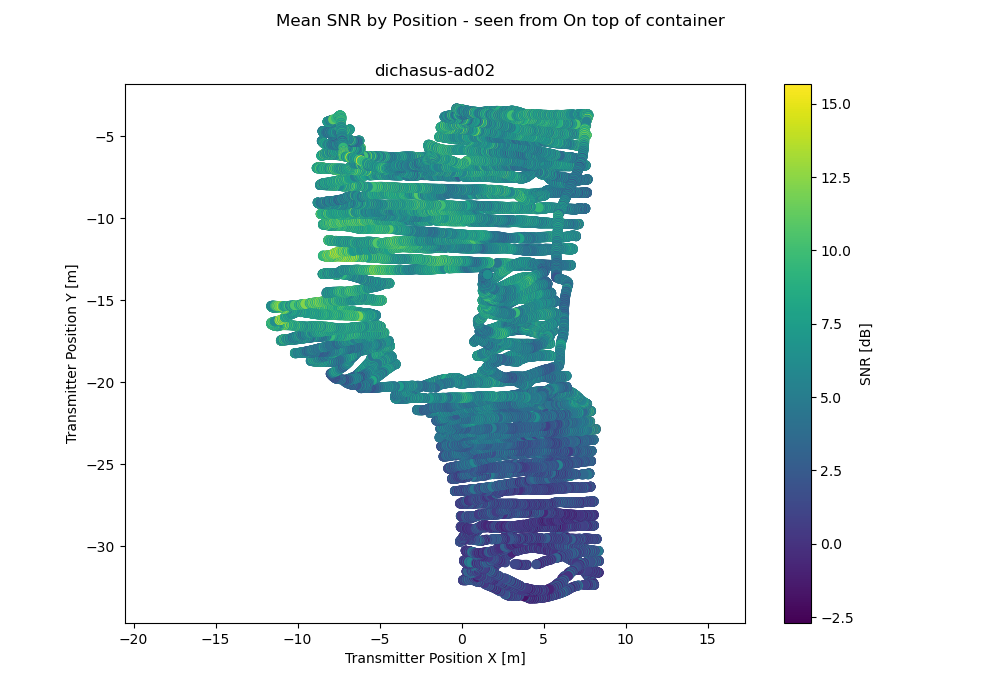
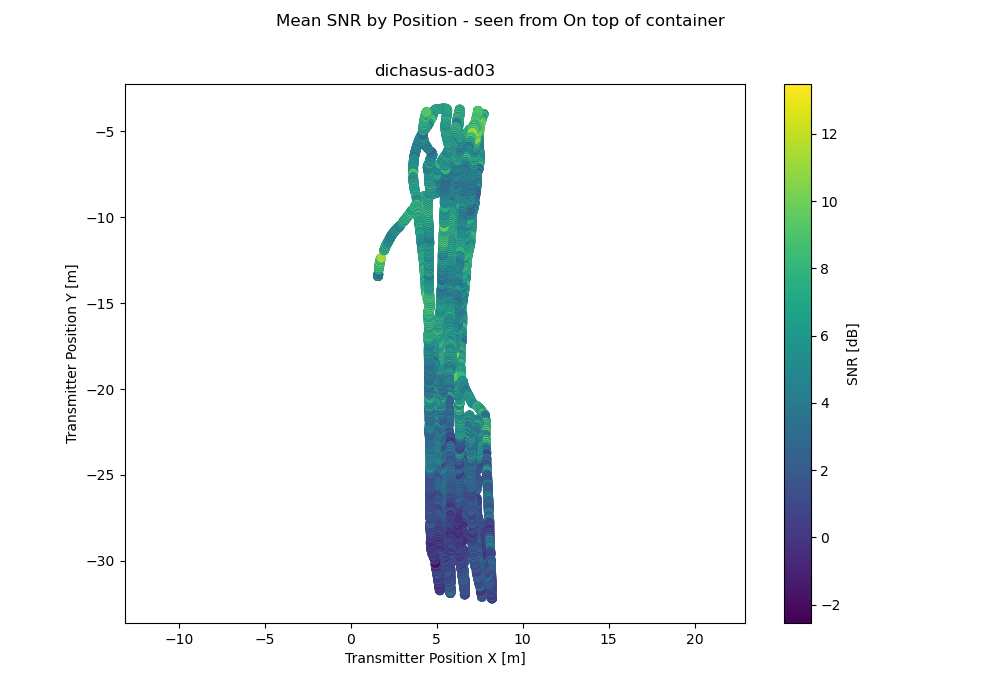
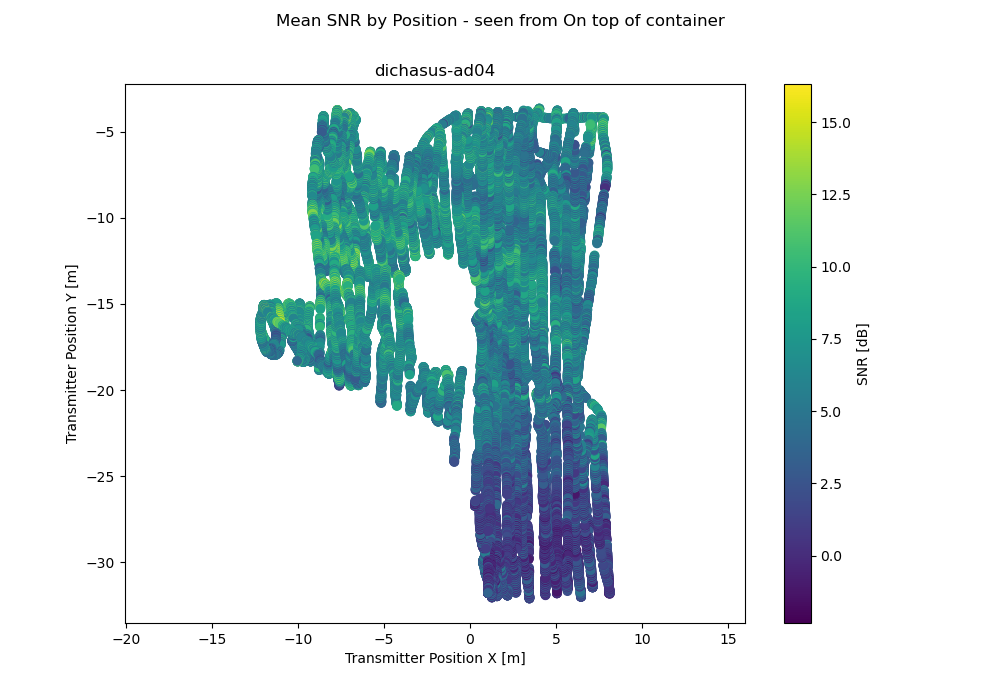
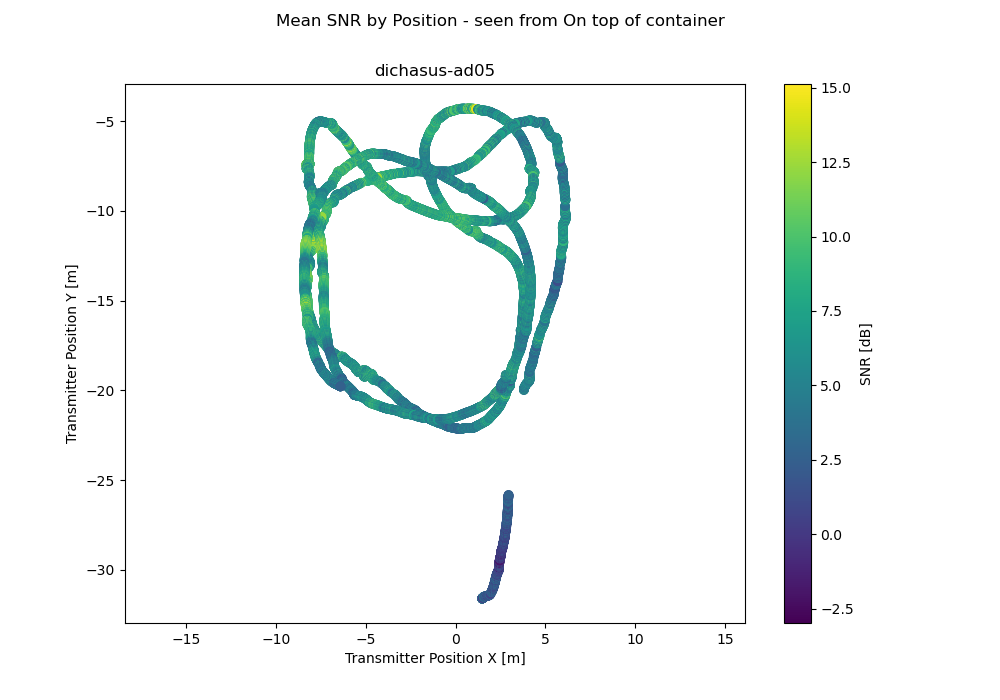
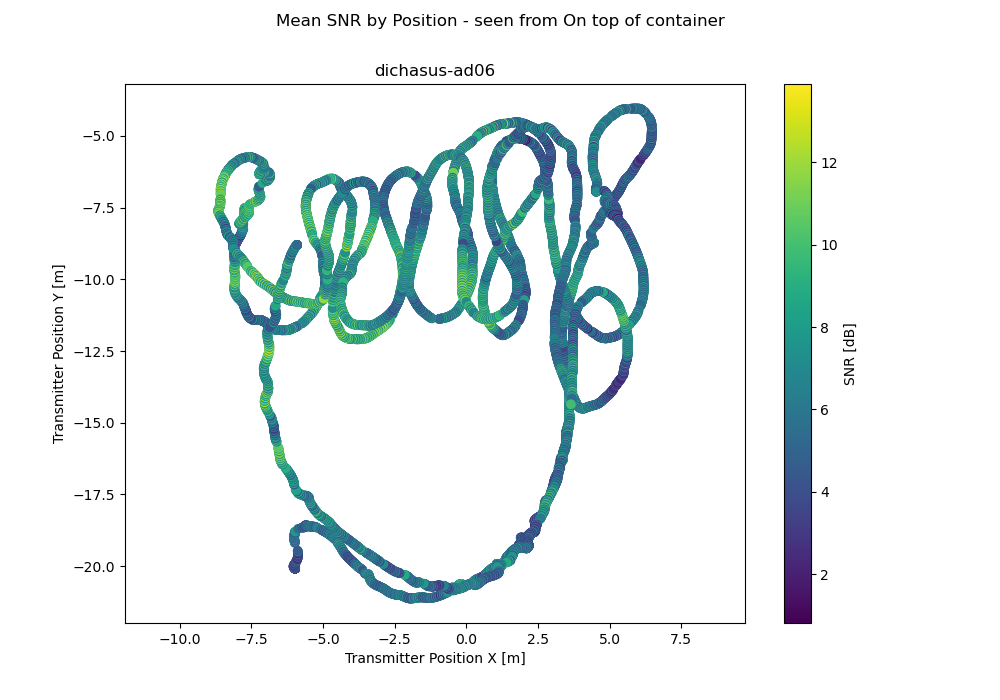
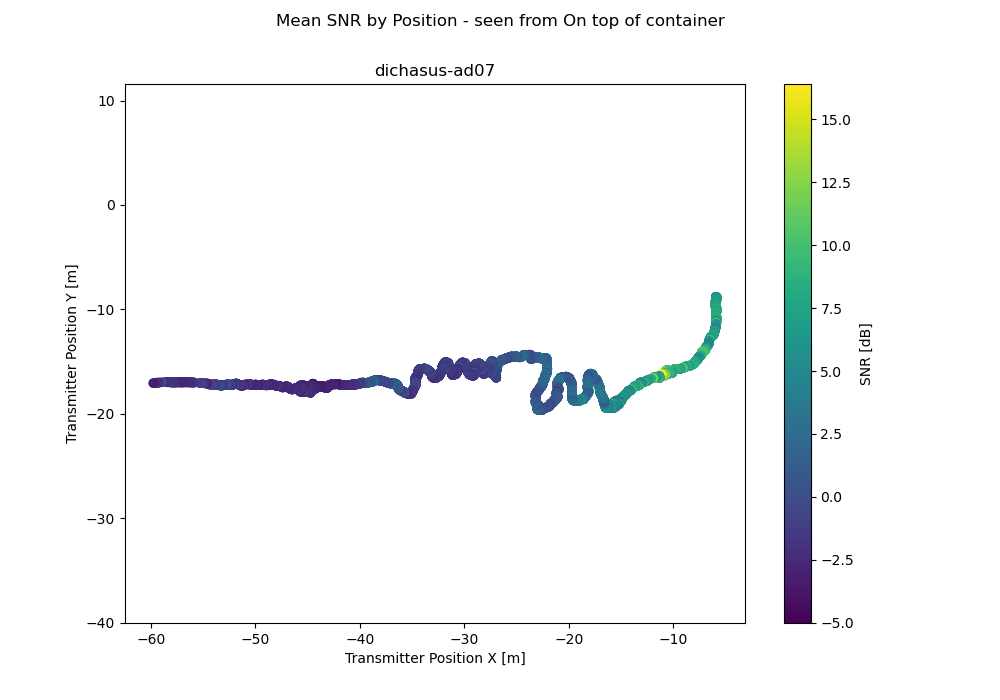
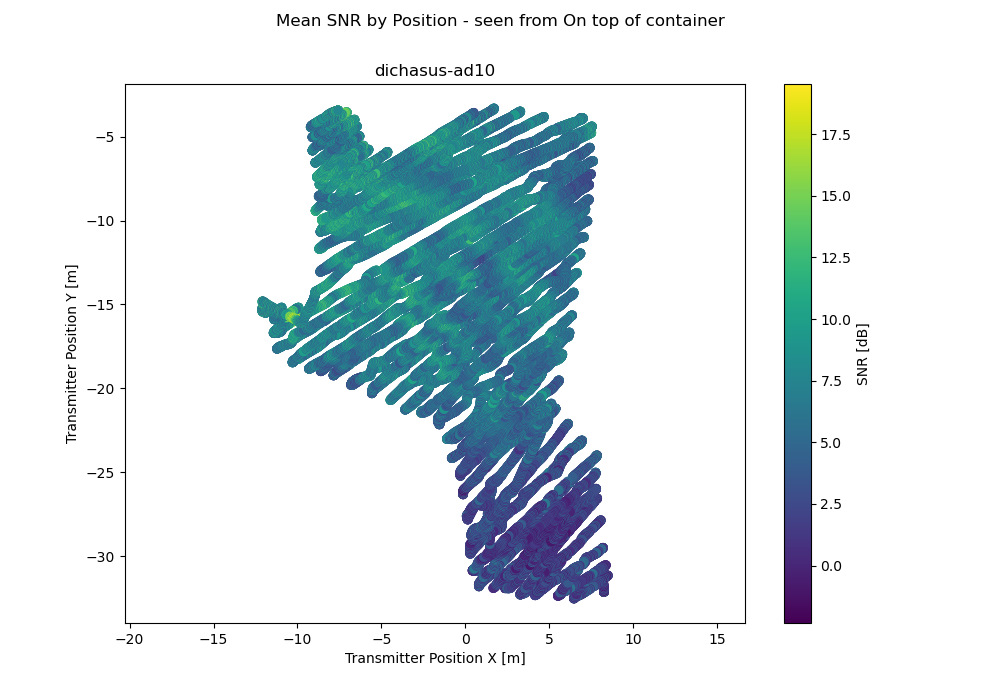
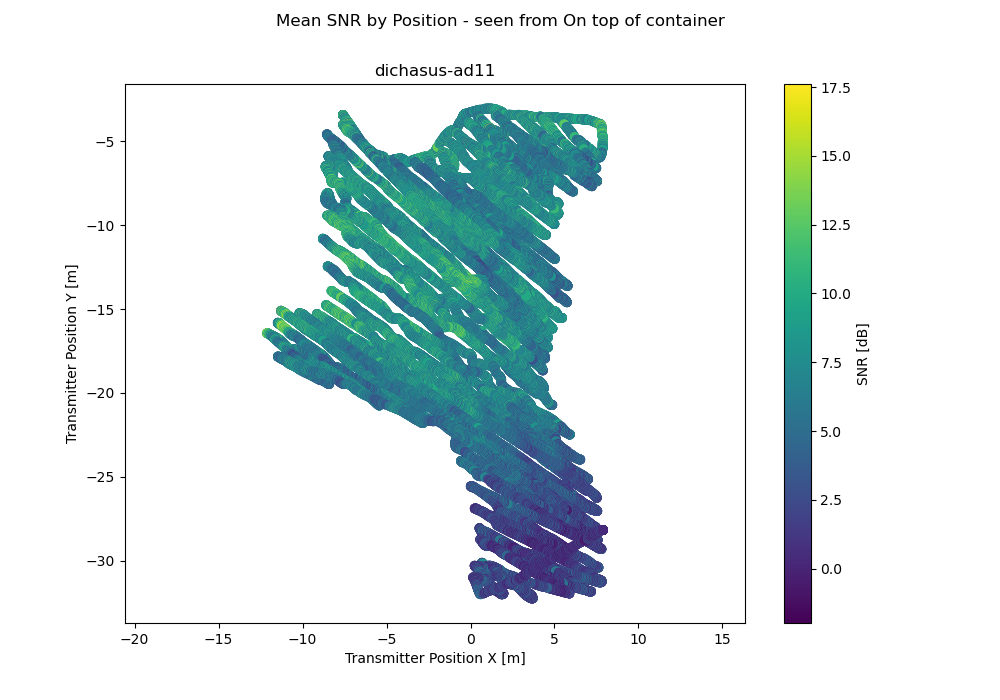
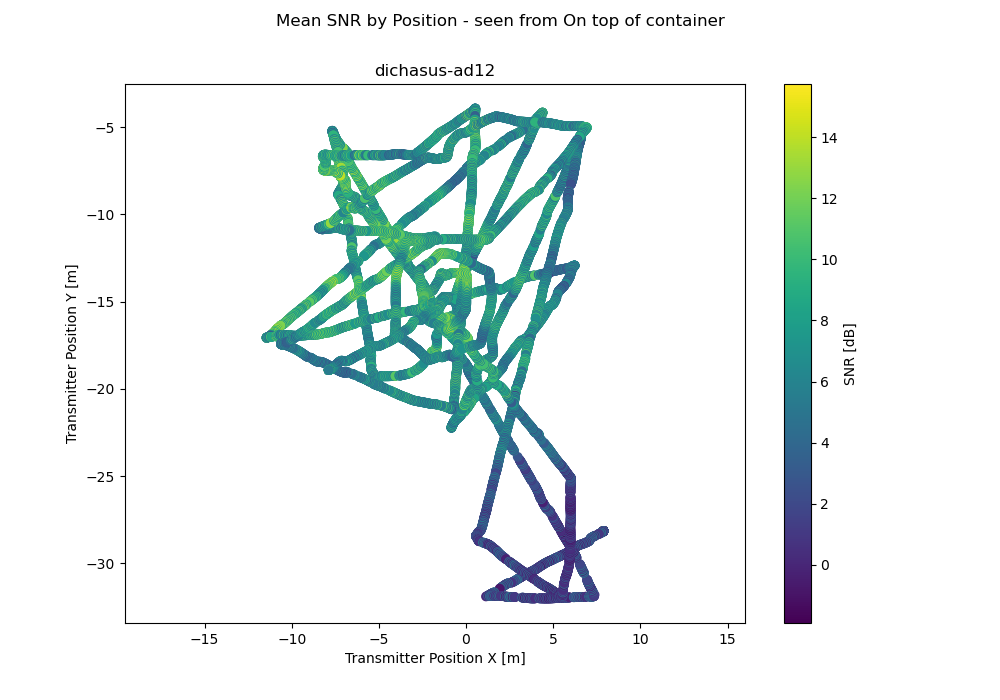
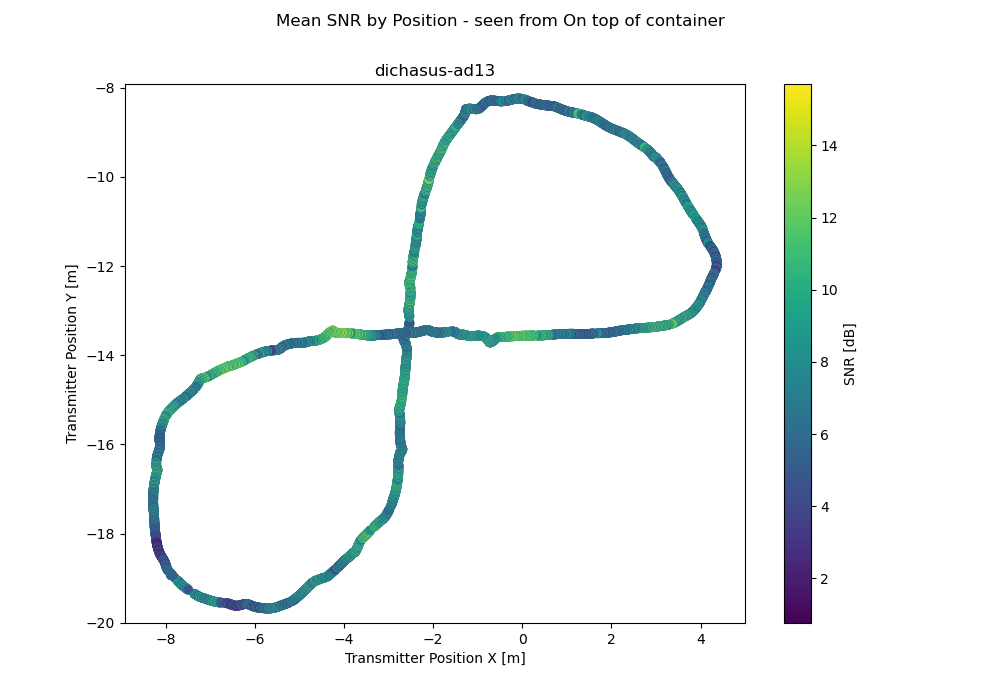
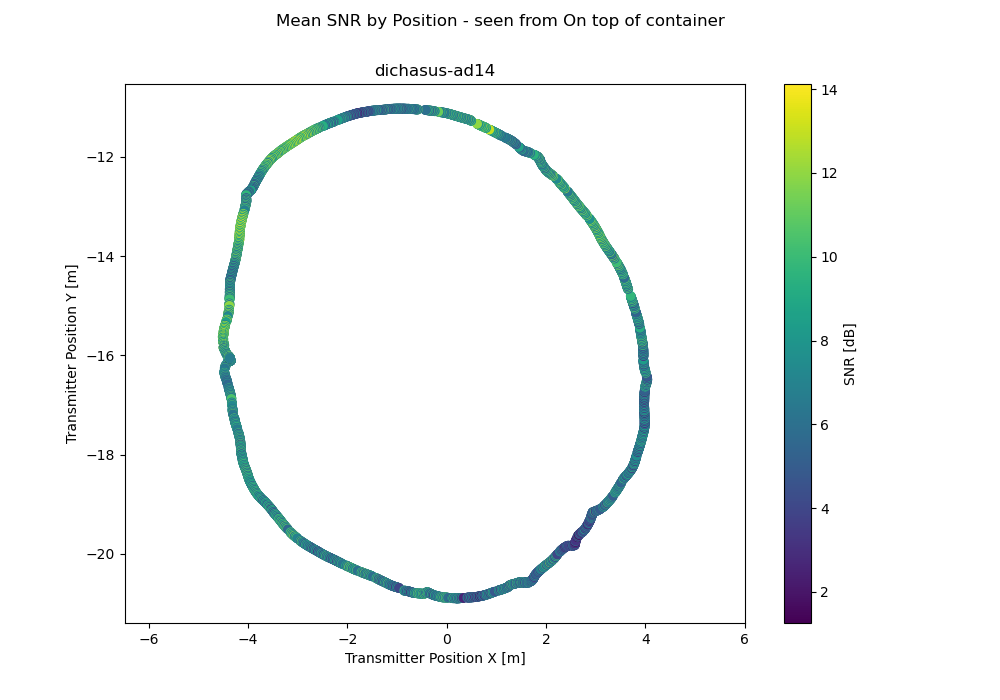
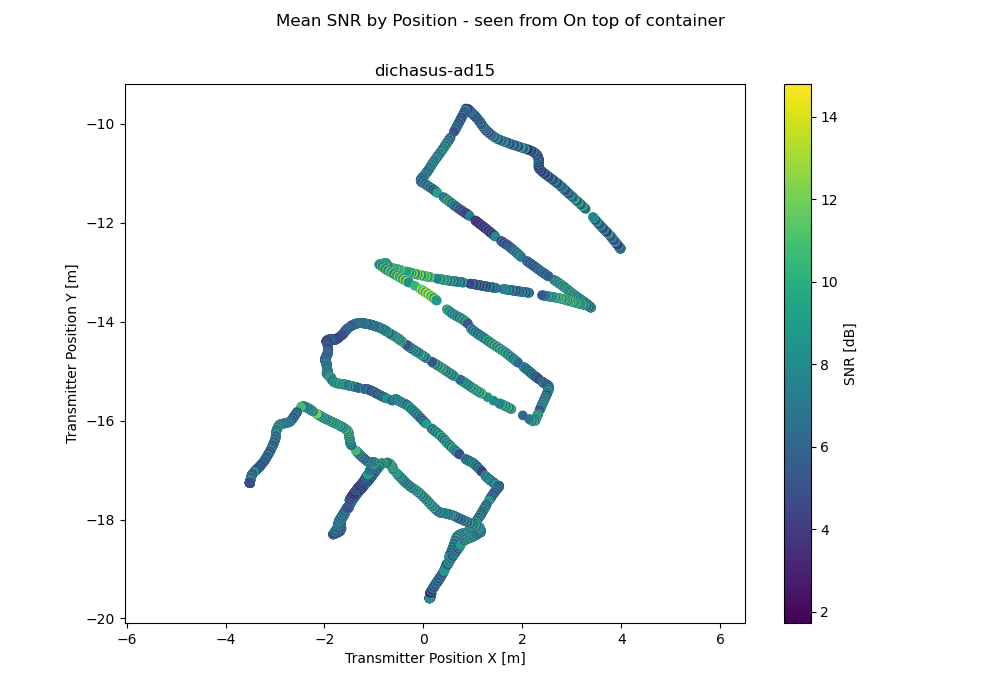
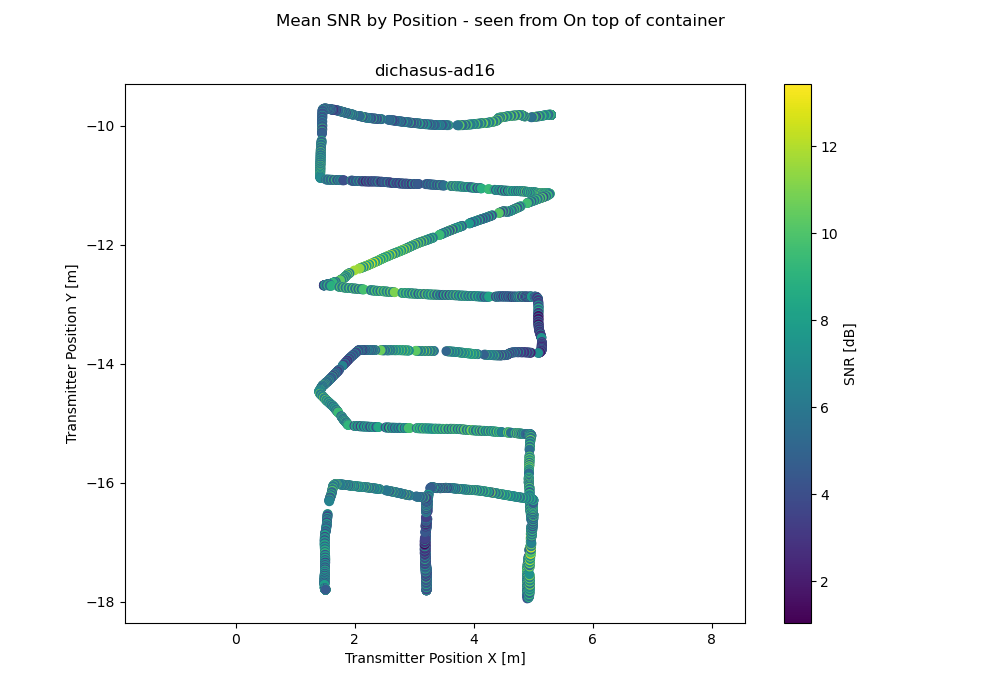
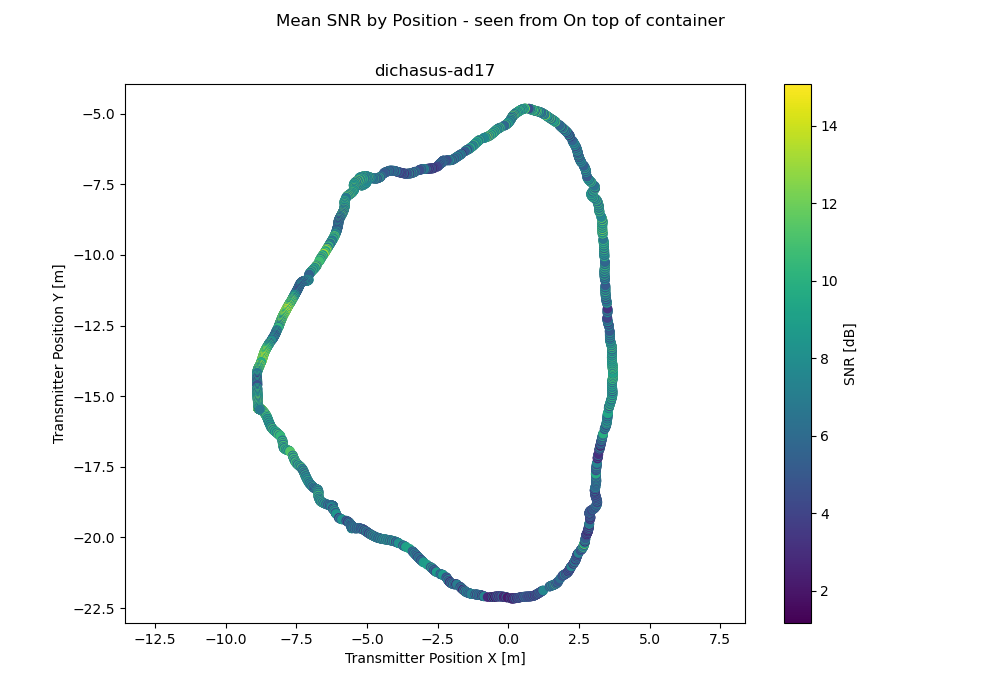
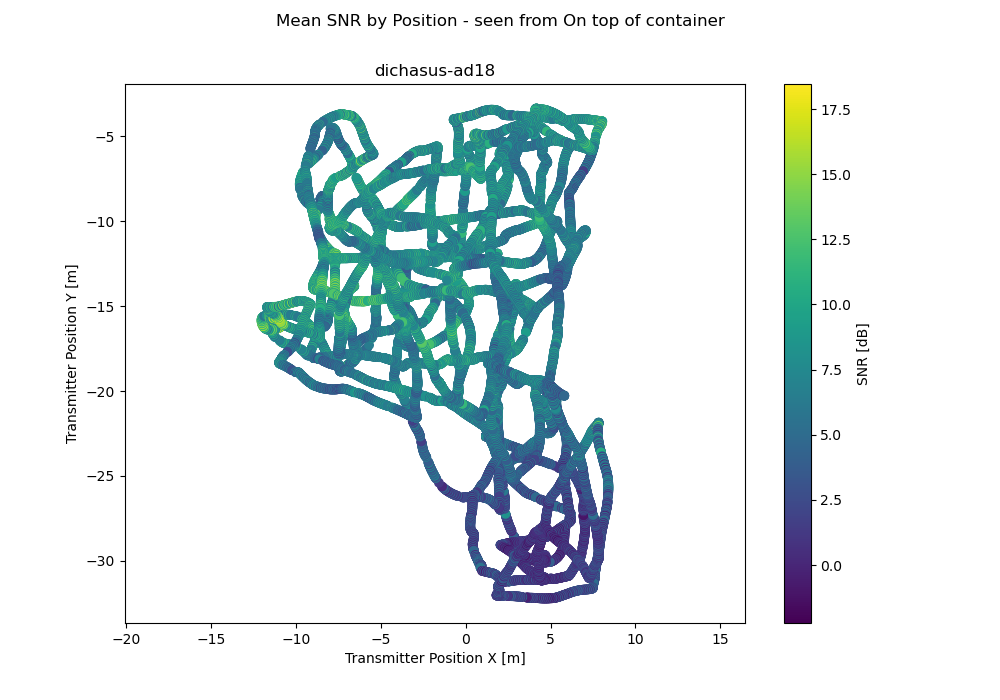
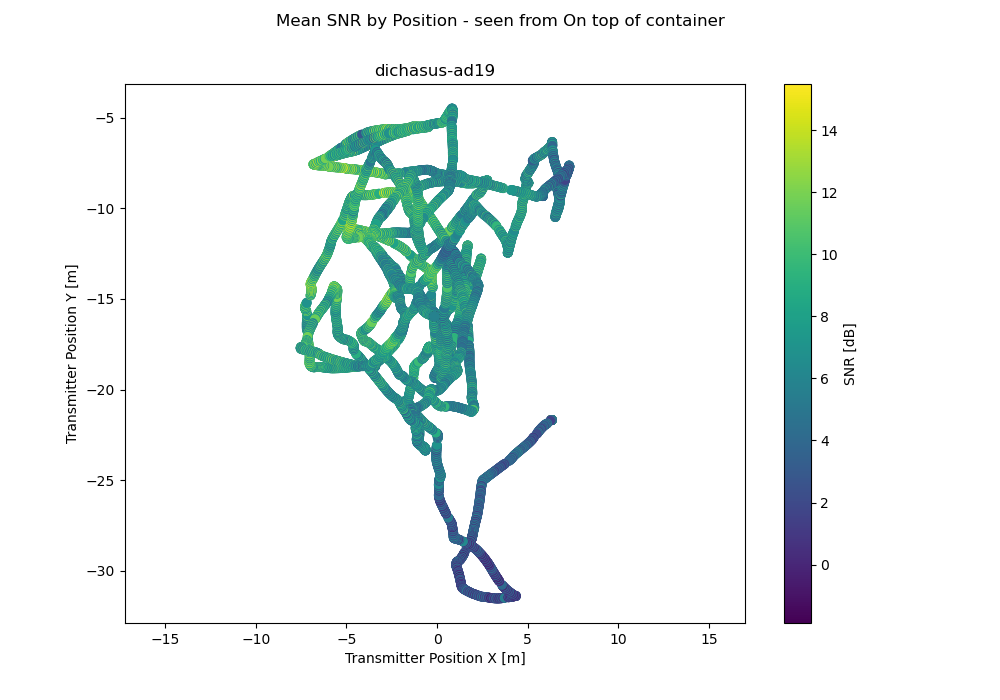
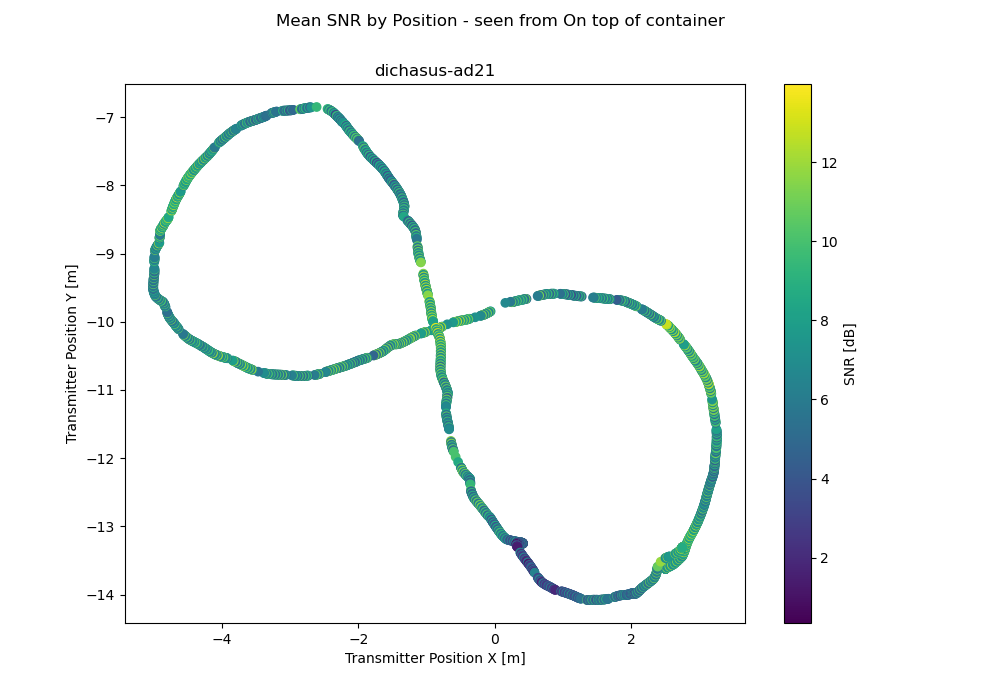
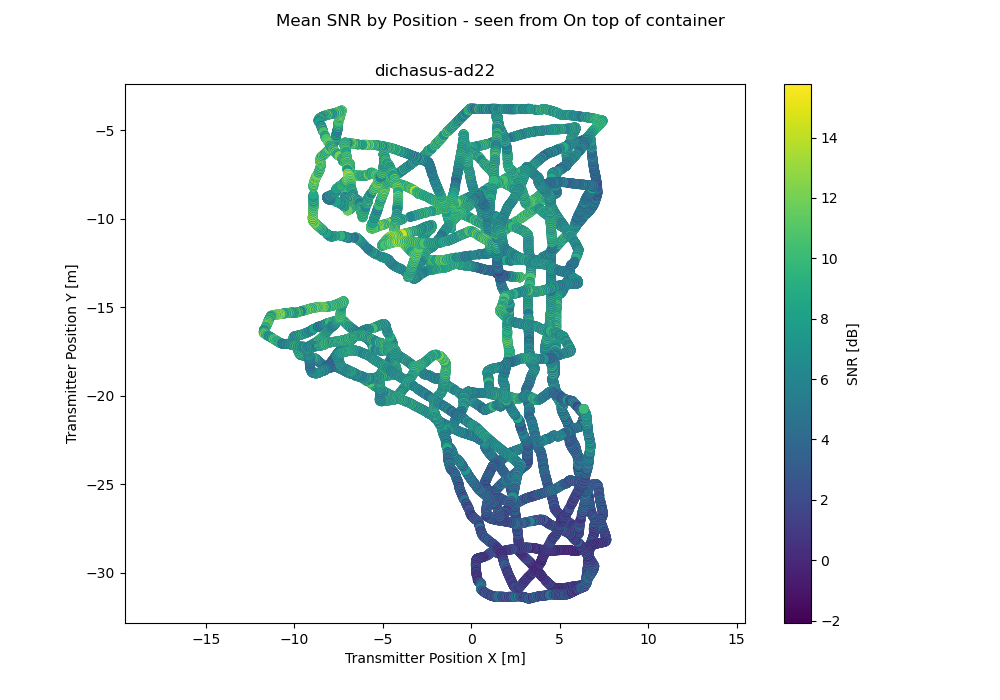
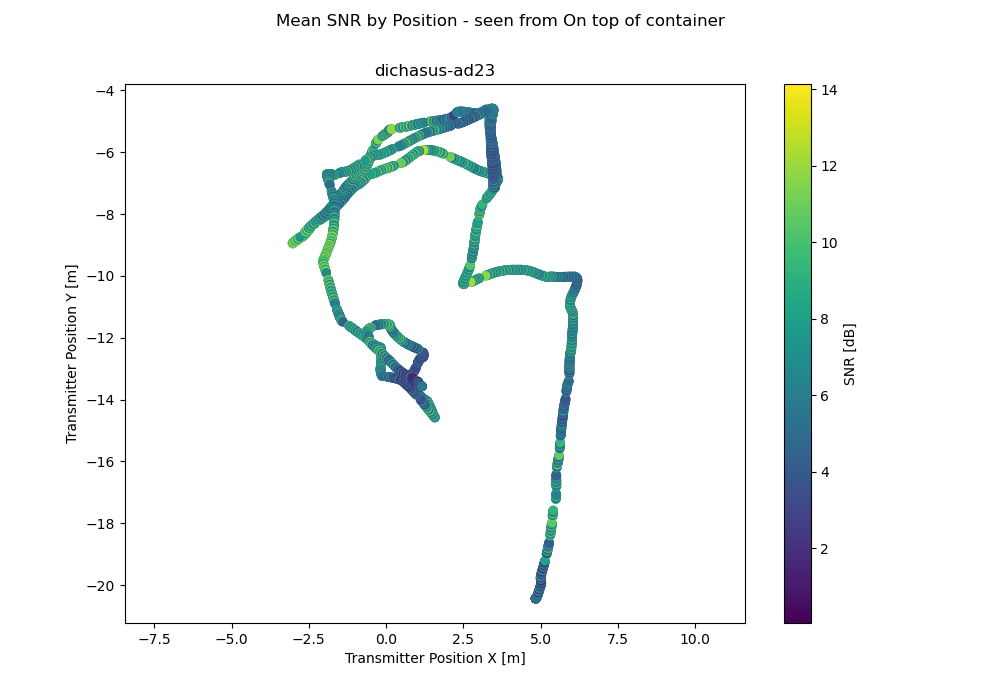
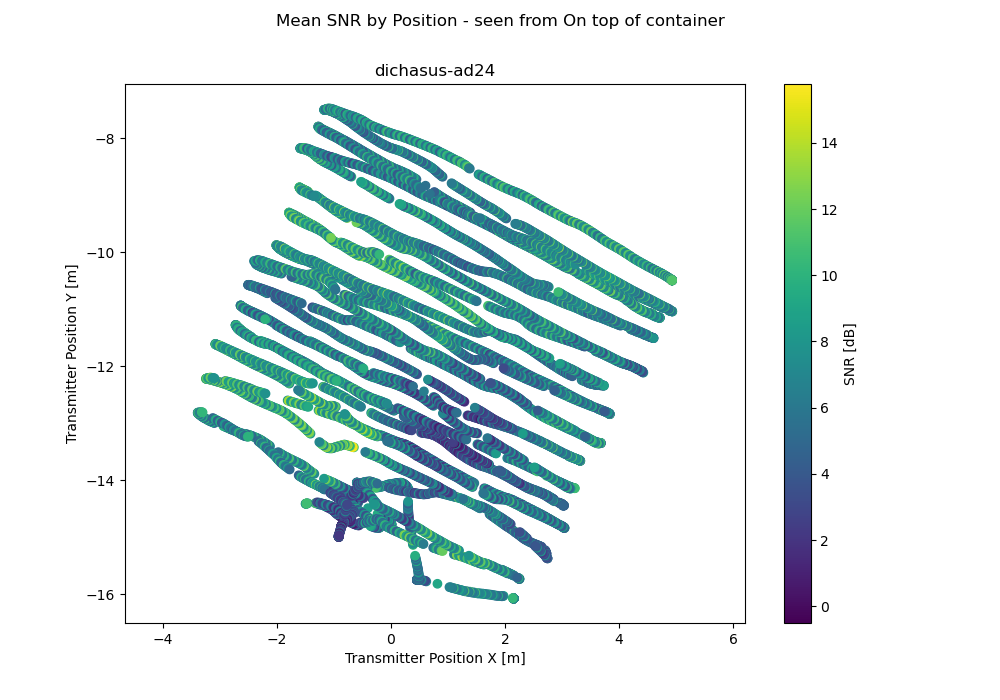
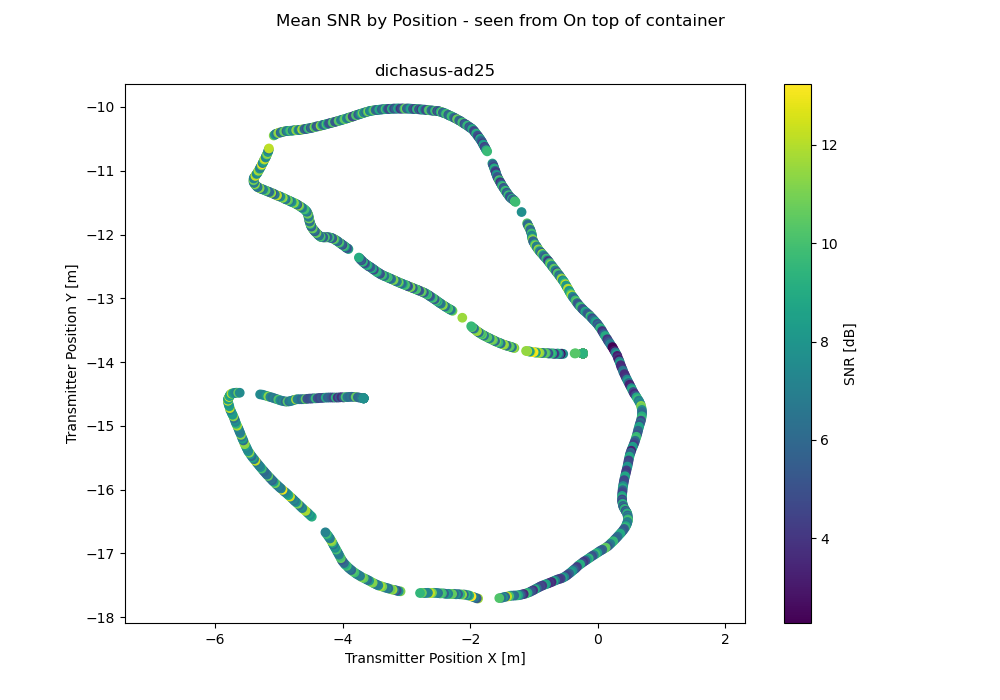
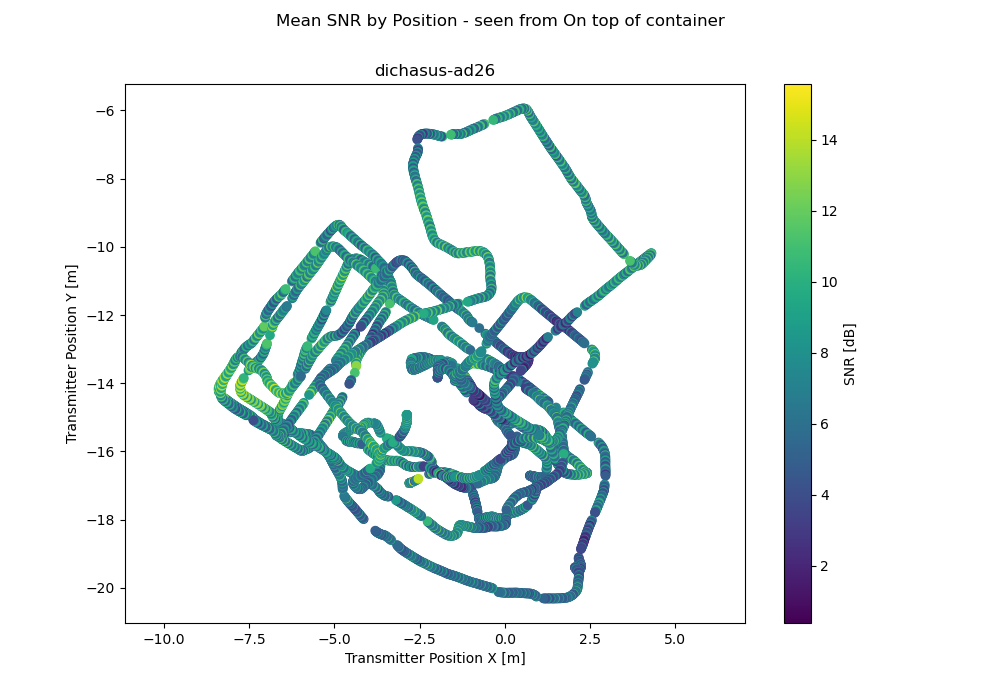
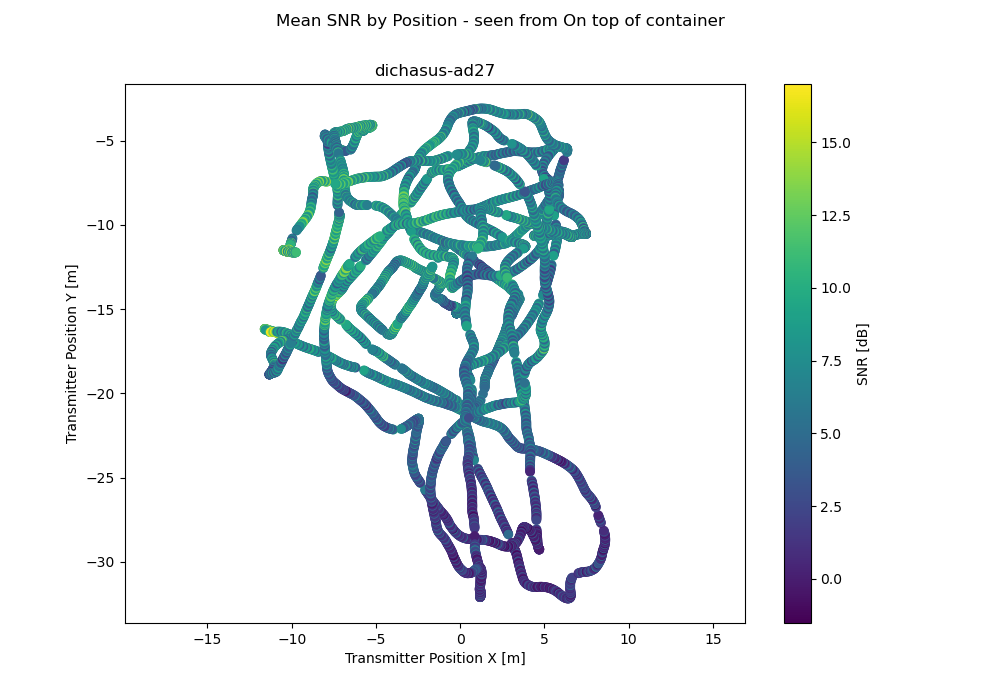
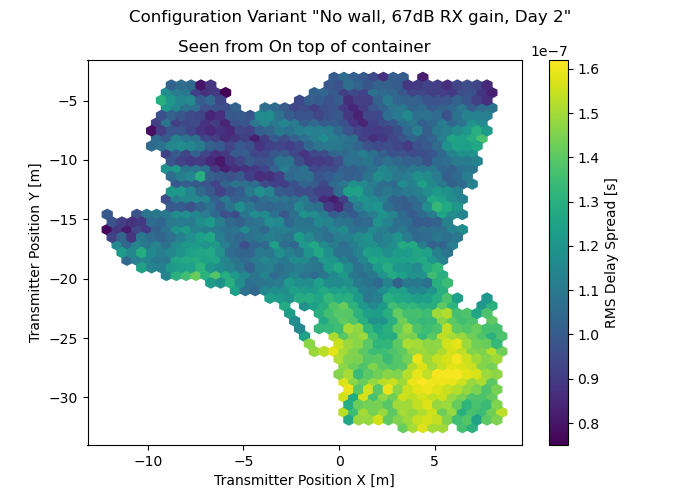
Antenna 4: On top of container
| 57 | 45 | 42 | 28 | 63 | 55 | 46 | 43 |
| 7 | 18 | 52 | 21 | 13 | 37 | 50 | 51 |
Python: Import with TensorFlow
#!/usr/bin/env python3
import tensorflow as tf
raw_dataset = tf.data.TFRecordDataset(["tfrecords/dichasus-ad00.tfrecords", "tfrecords/dichasus-ad01.tfrecords", "tfrecords/dichasus-ad02.tfrecords", "tfrecords/dichasus-ad03.tfrecords", "tfrecords/dichasus-ad04.tfrecords", "tfrecords/dichasus-ad05.tfrecords", "tfrecords/dichasus-ad06.tfrecords", "tfrecords/dichasus-ad07.tfrecords", "tfrecords/dichasus-ad08.tfrecords", "tfrecords/dichasus-ad09.tfrecords", "tfrecords/dichasus-ad10.tfrecords", "tfrecords/dichasus-ad11.tfrecords", "tfrecords/dichasus-ad12.tfrecords", "tfrecords/dichasus-ad13.tfrecords", "tfrecords/dichasus-ad14.tfrecords", "tfrecords/dichasus-ad15.tfrecords", "tfrecords/dichasus-ad16.tfrecords", "tfrecords/dichasus-ad17.tfrecords", "tfrecords/dichasus-ad18.tfrecords", "tfrecords/dichasus-ad19.tfrecords", "tfrecords/dichasus-ad21.tfrecords", "tfrecords/dichasus-ad22.tfrecords", "tfrecords/dichasus-ad23.tfrecords", "tfrecords/dichasus-ad24.tfrecords", "tfrecords/dichasus-ad25.tfrecords", "tfrecords/dichasus-ad26.tfrecords", "tfrecords/dichasus-ad27.tfrecords"])
feature_description = {
"cfo": tf.io.FixedLenFeature([], tf.string, default_value = ''),
"csi": tf.io.FixedLenFeature([], tf.string, default_value = ''),
"gt-interp-age-tachy": tf.io.FixedLenFeature([], tf.float32, default_value = 0),
"pos-tachy": tf.io.FixedLenFeature([], tf.string, default_value = ''),
"snr": tf.io.FixedLenFeature([], tf.string, default_value = ''),
"time": tf.io.FixedLenFeature([], tf.float32, default_value = 0),
}
def record_parse_function(proto):
record = tf.io.parse_single_example(proto, feature_description)
# Measured carrier frequency offset between MOBTX and each receive antenna.
cfo = tf.ensure_shape(tf.io.parse_tensor(record["cfo"], out_type = tf.float32), (64))
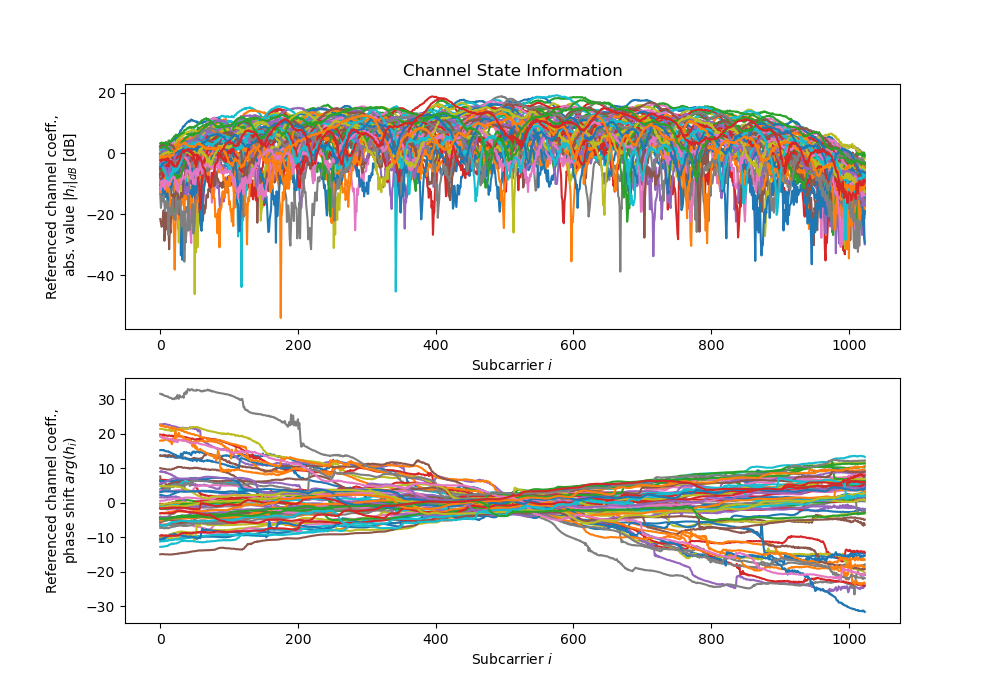
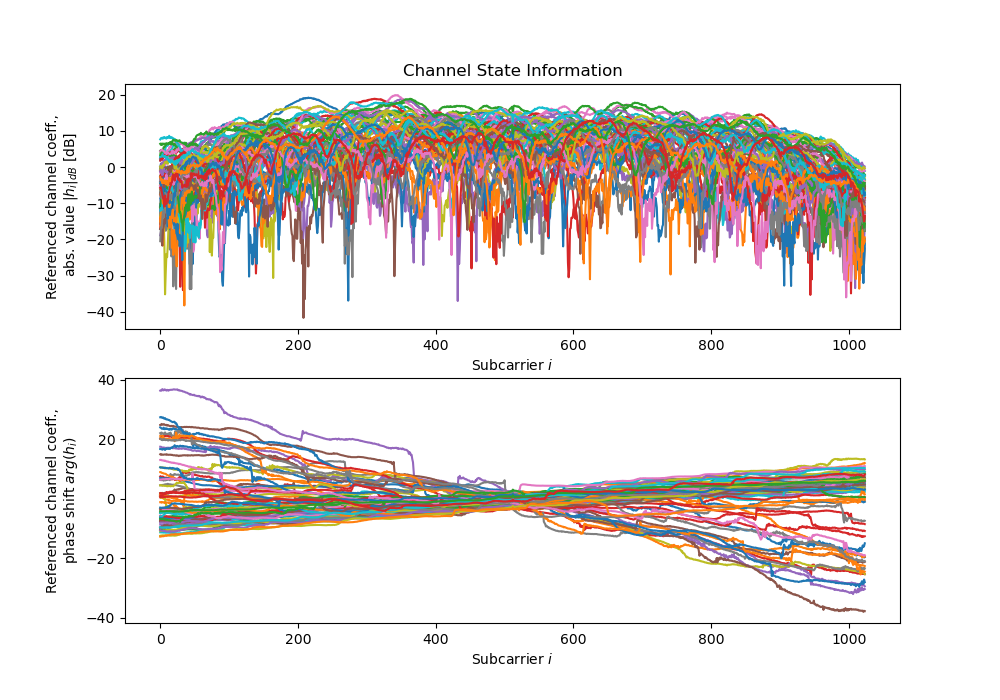
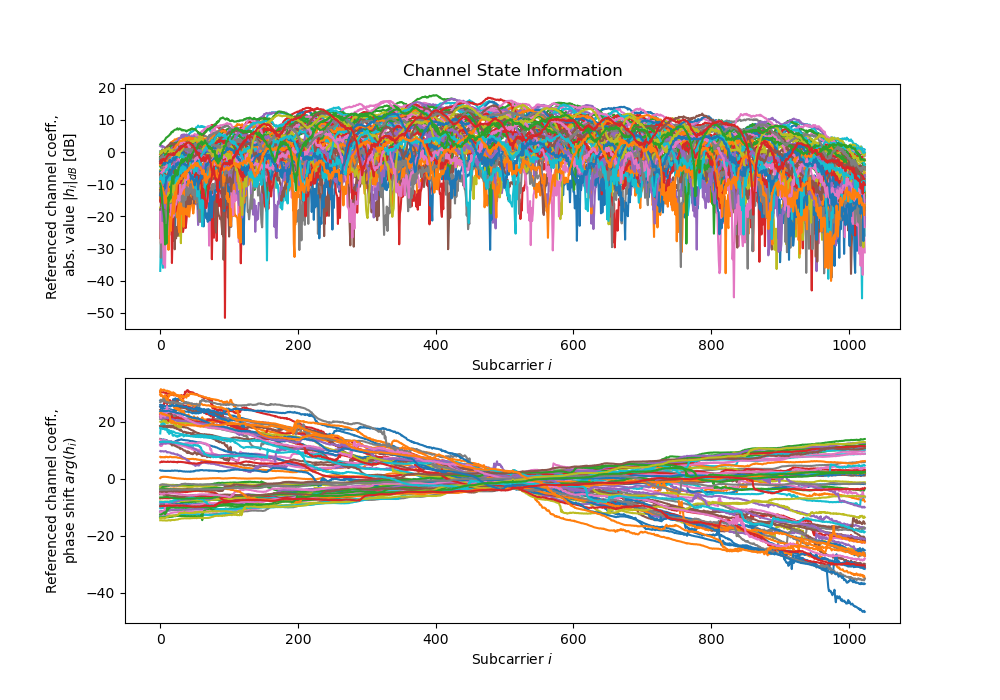
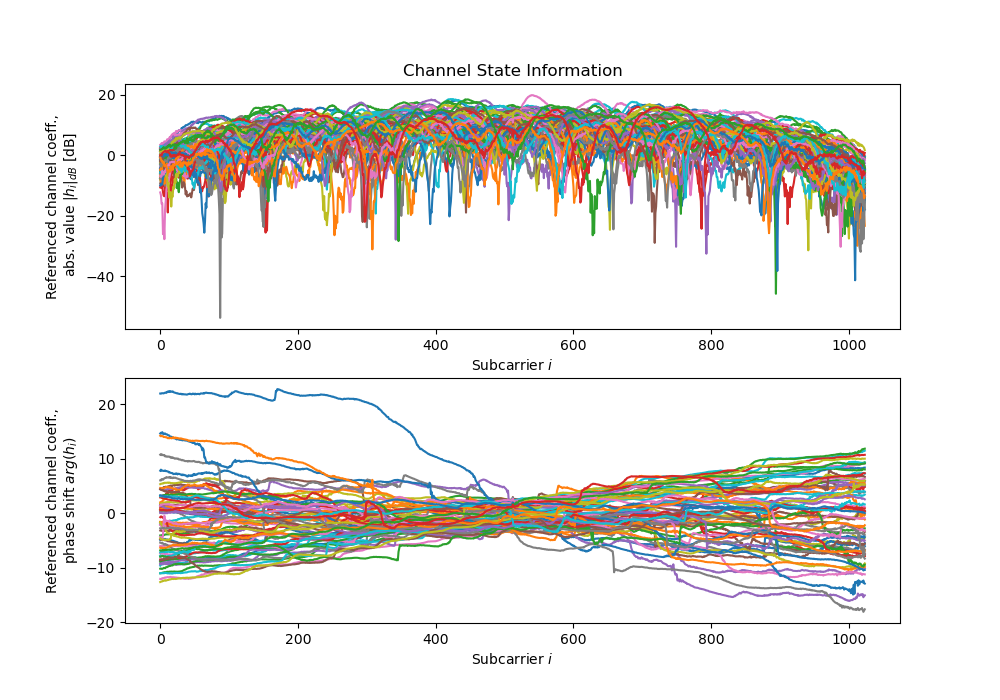
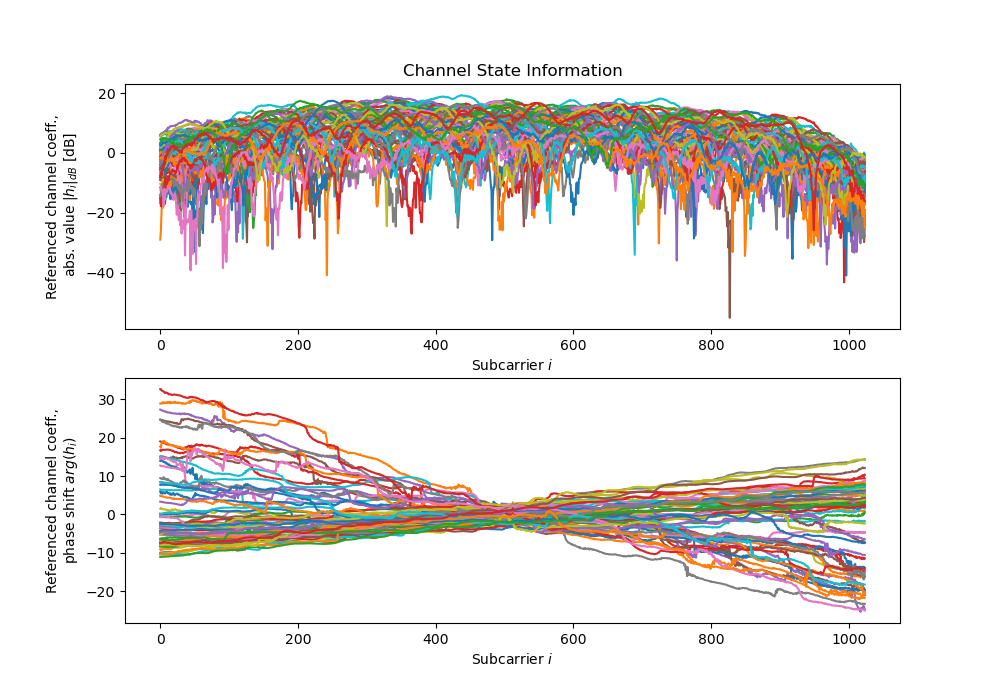
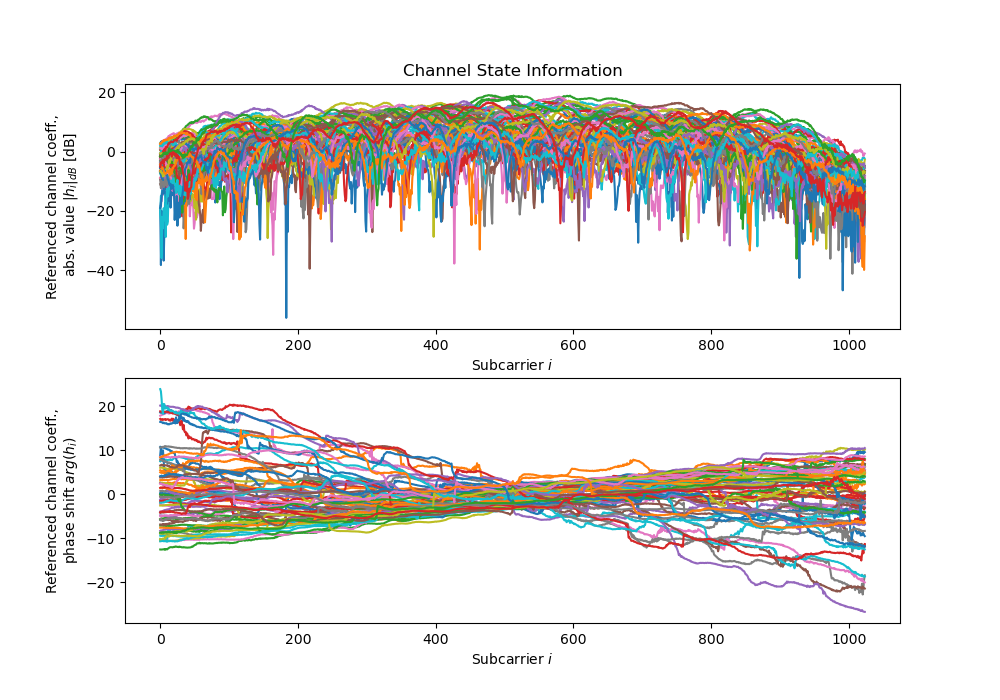
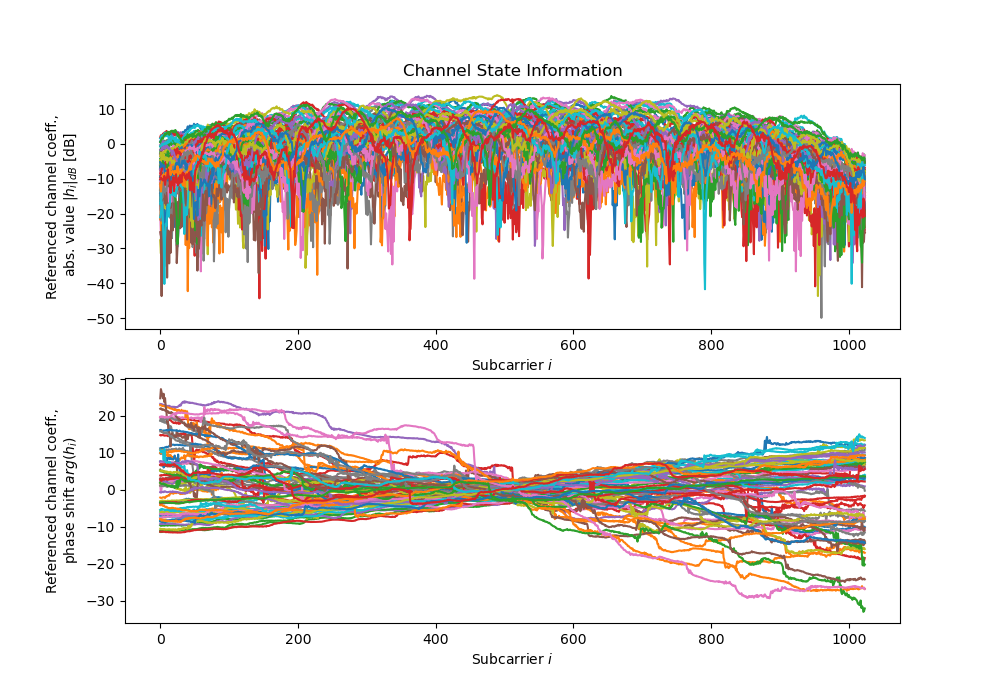
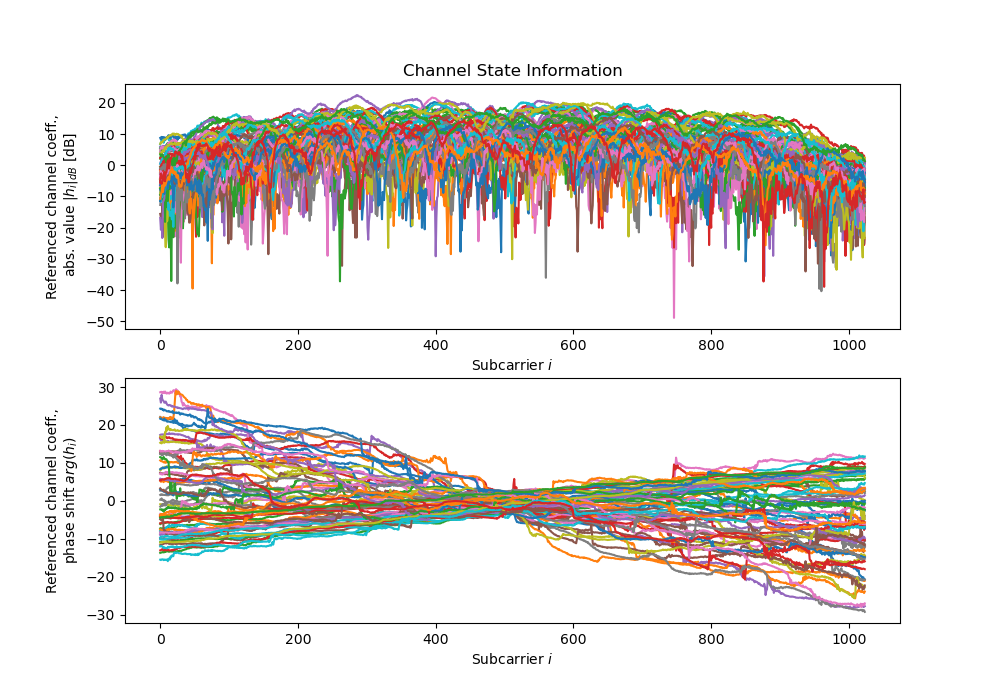
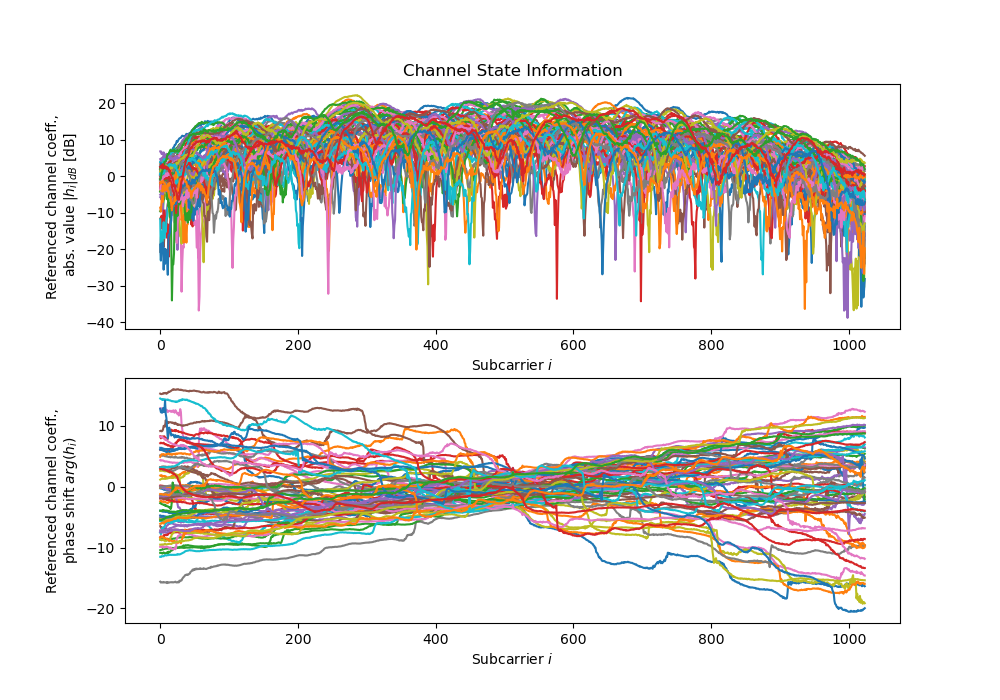
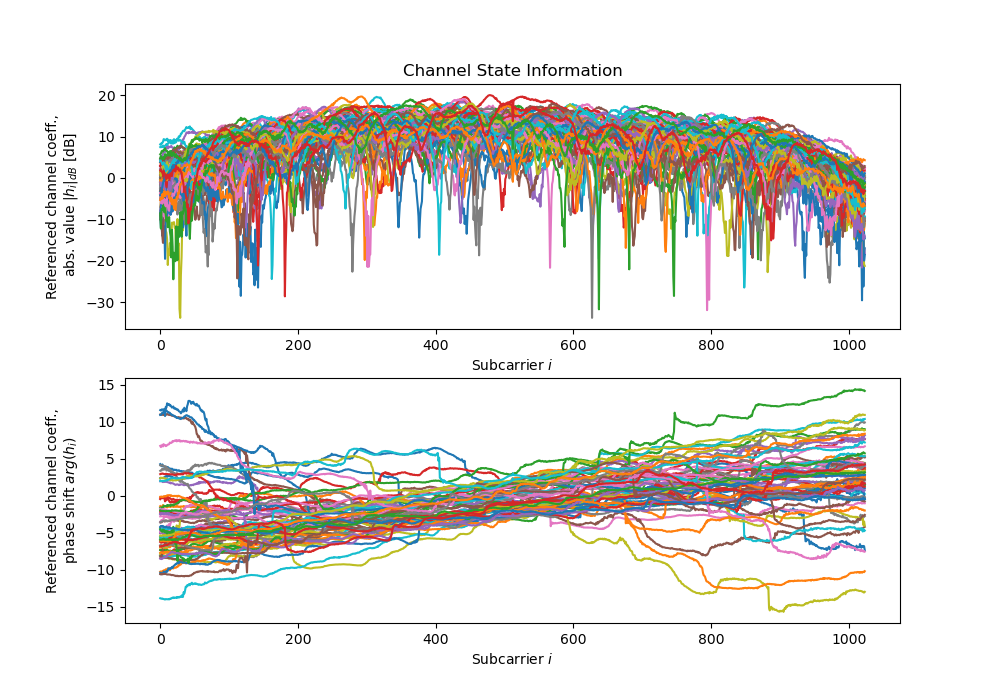
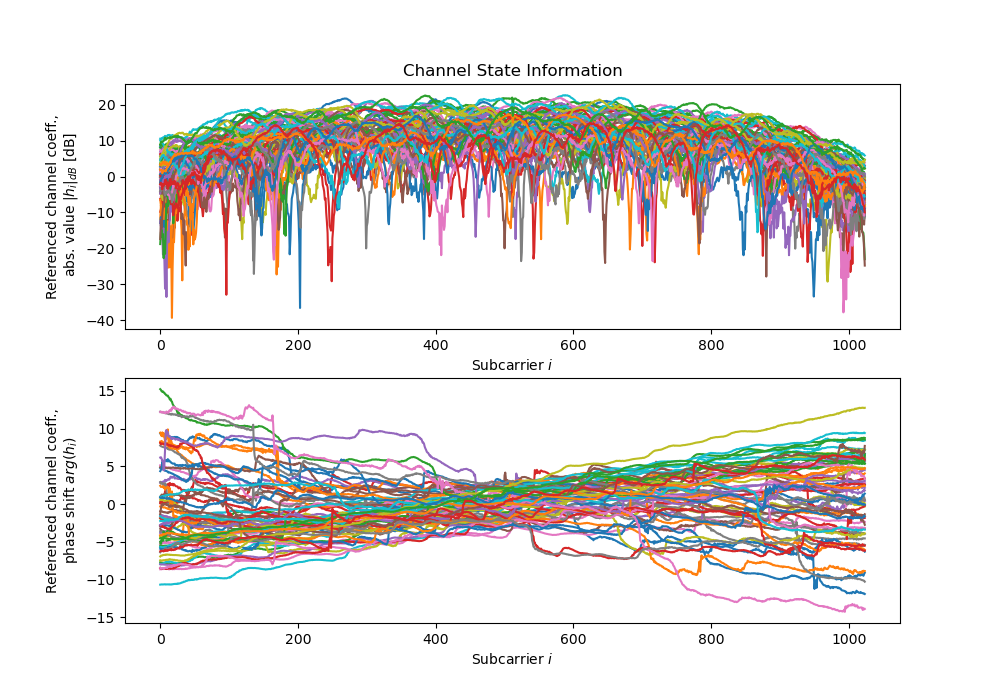
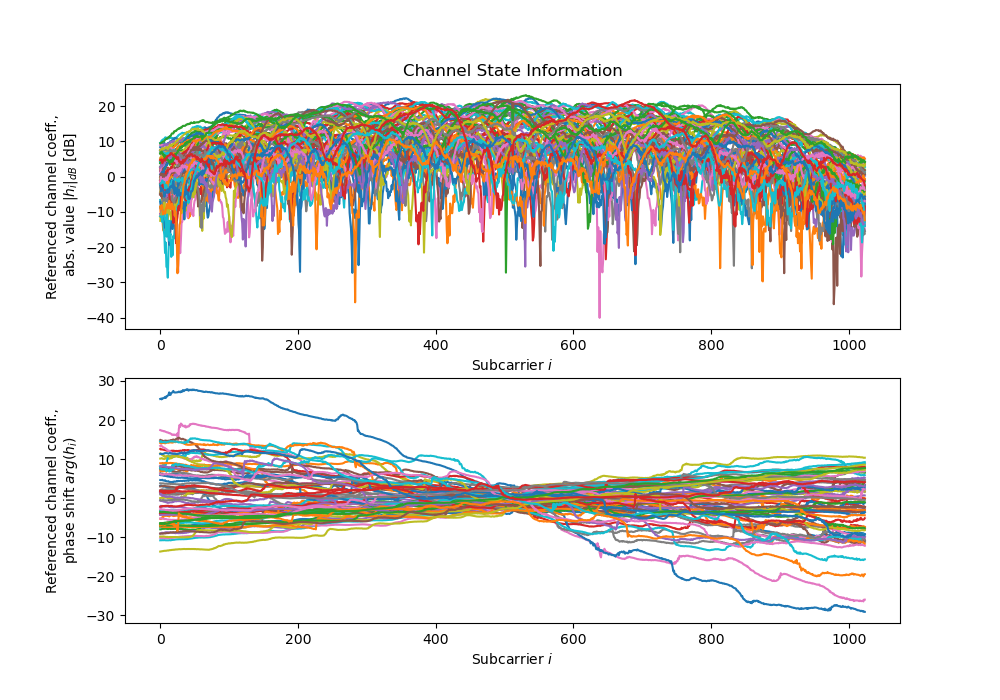
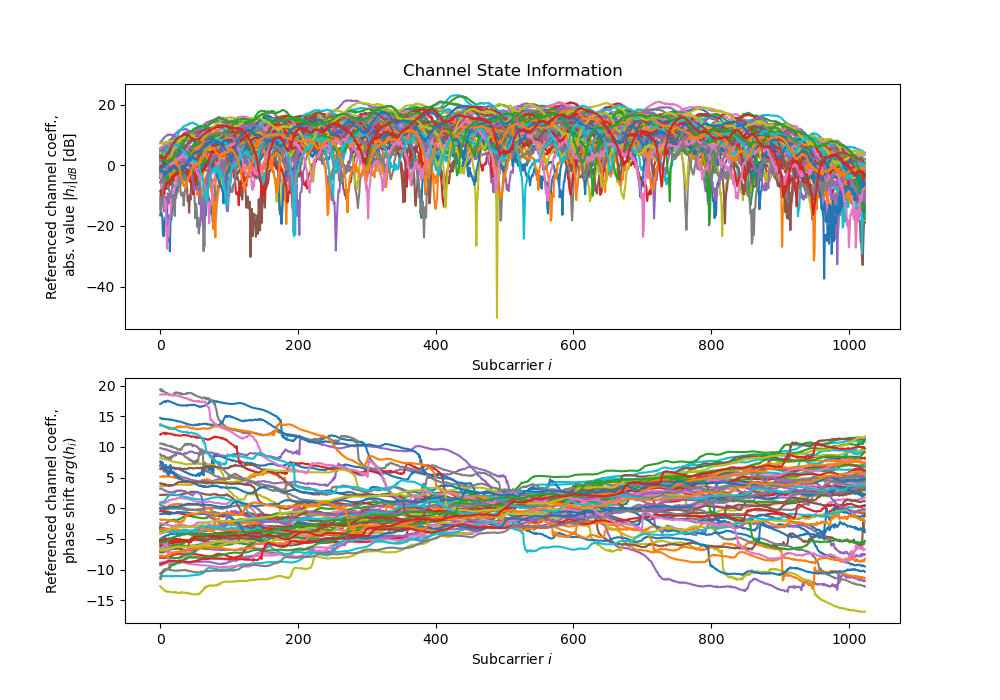
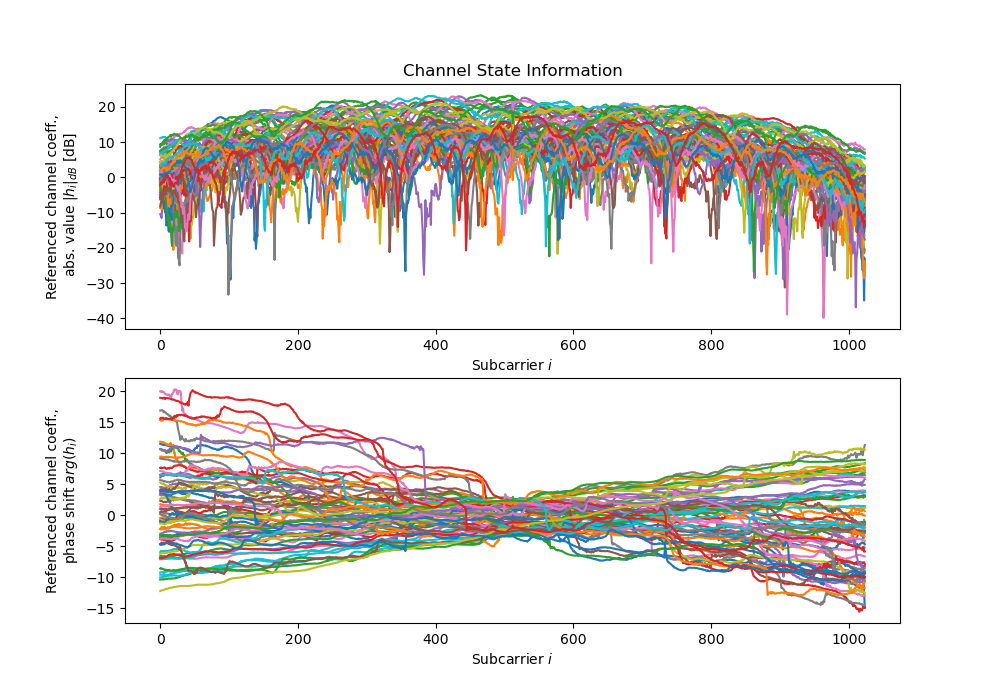
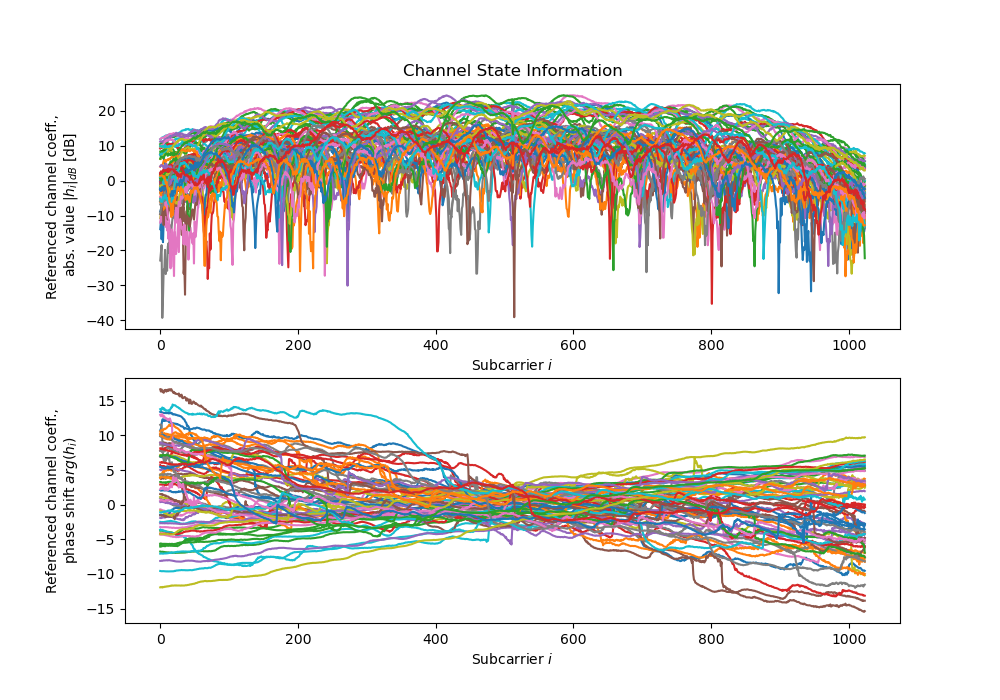
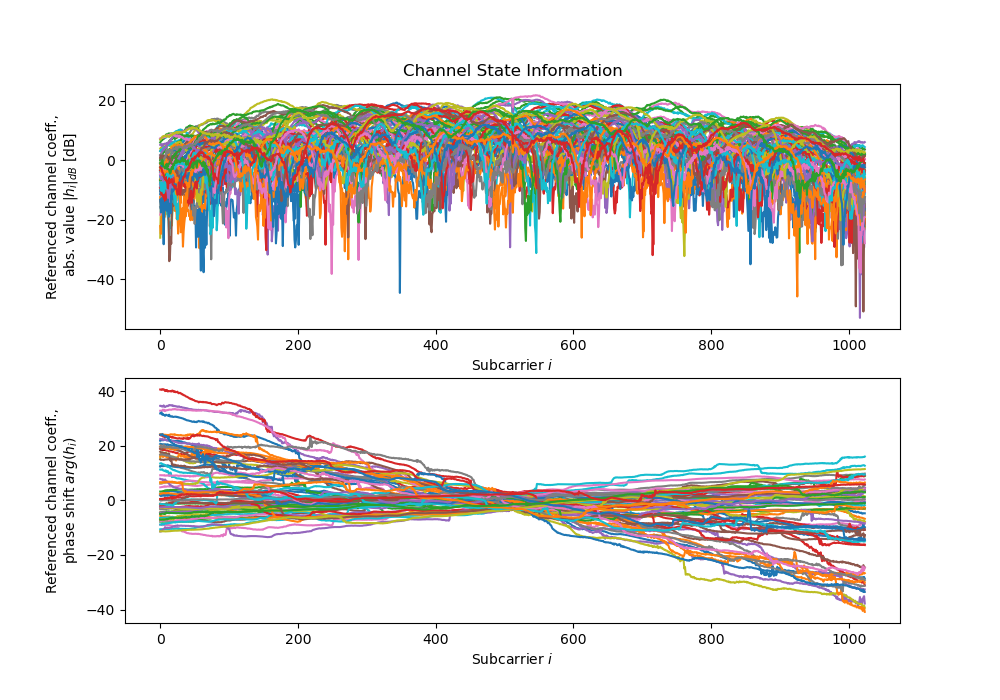
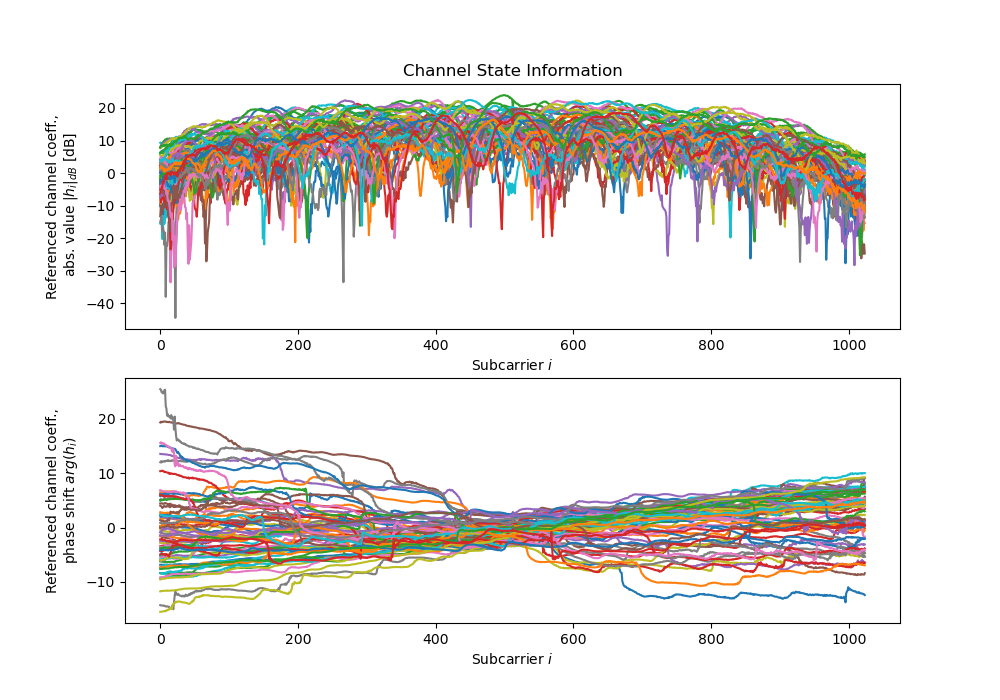
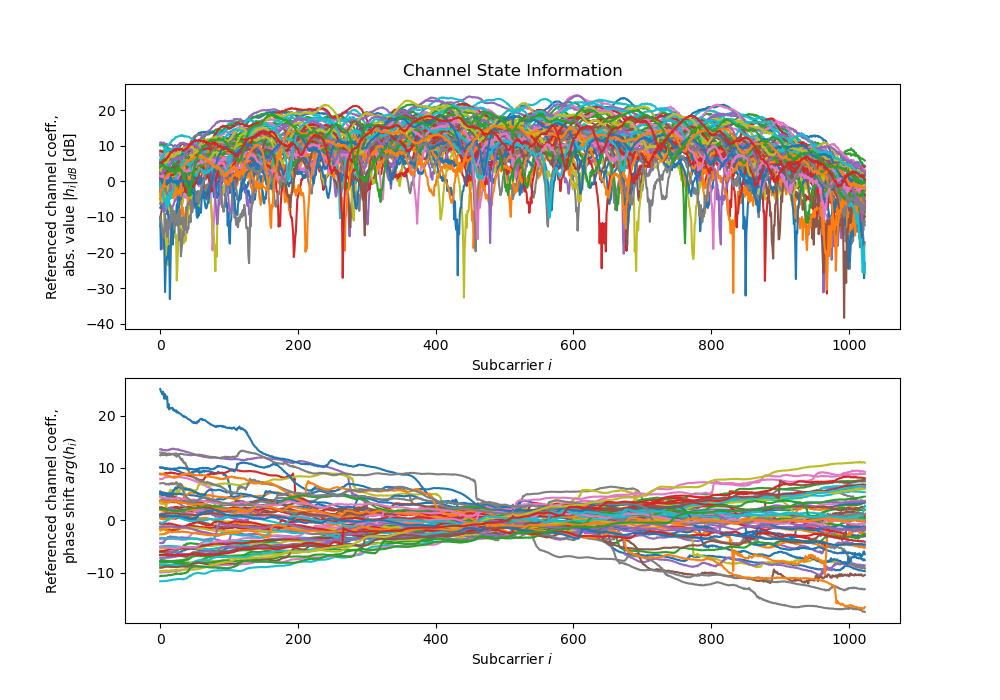
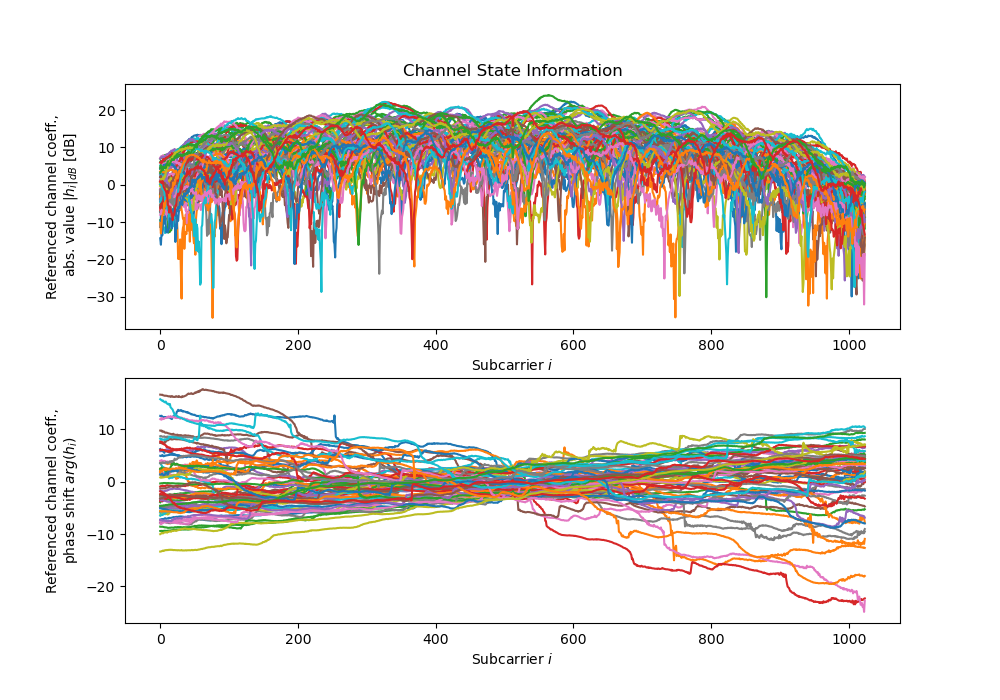
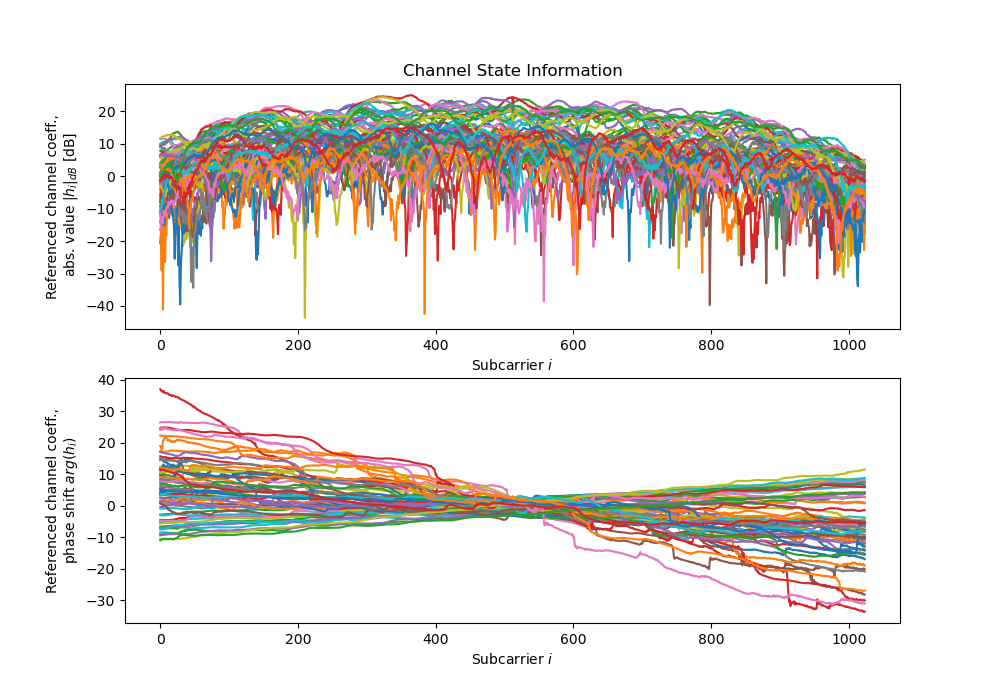
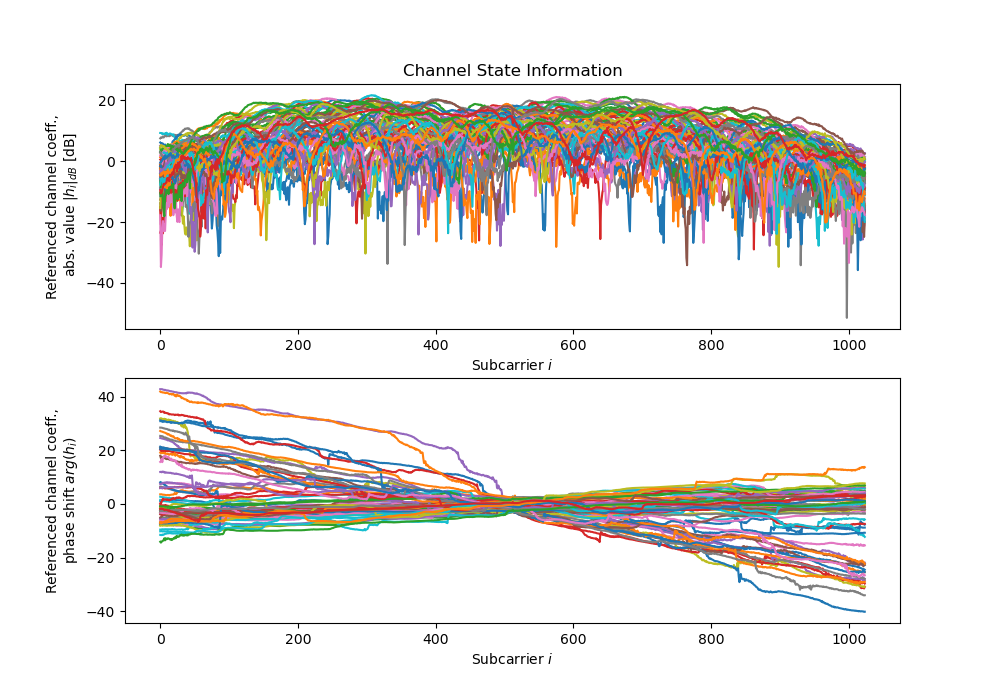
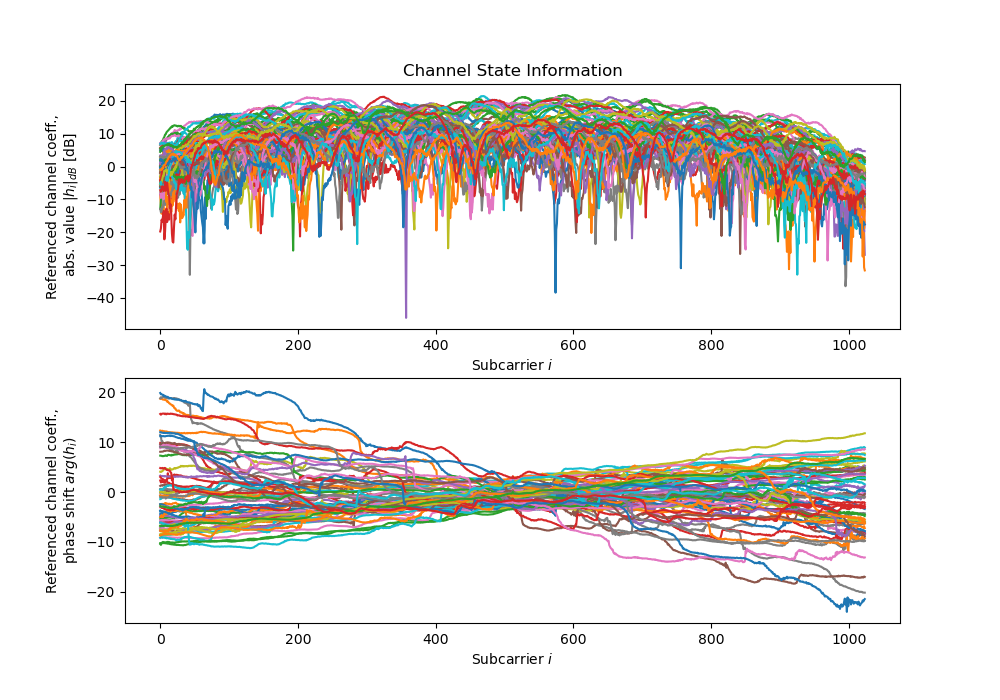
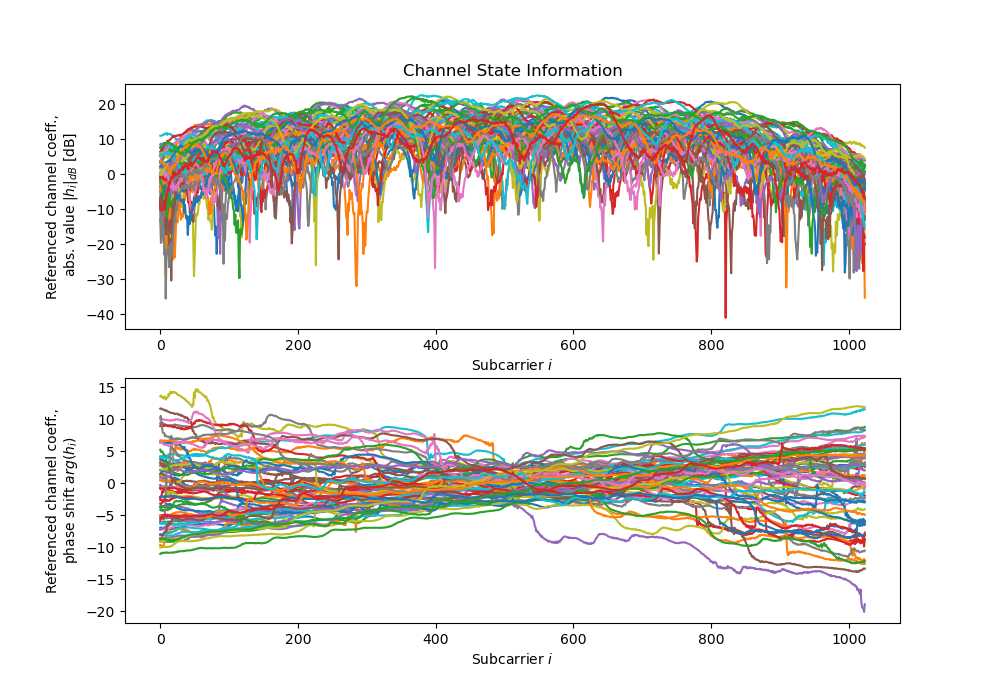
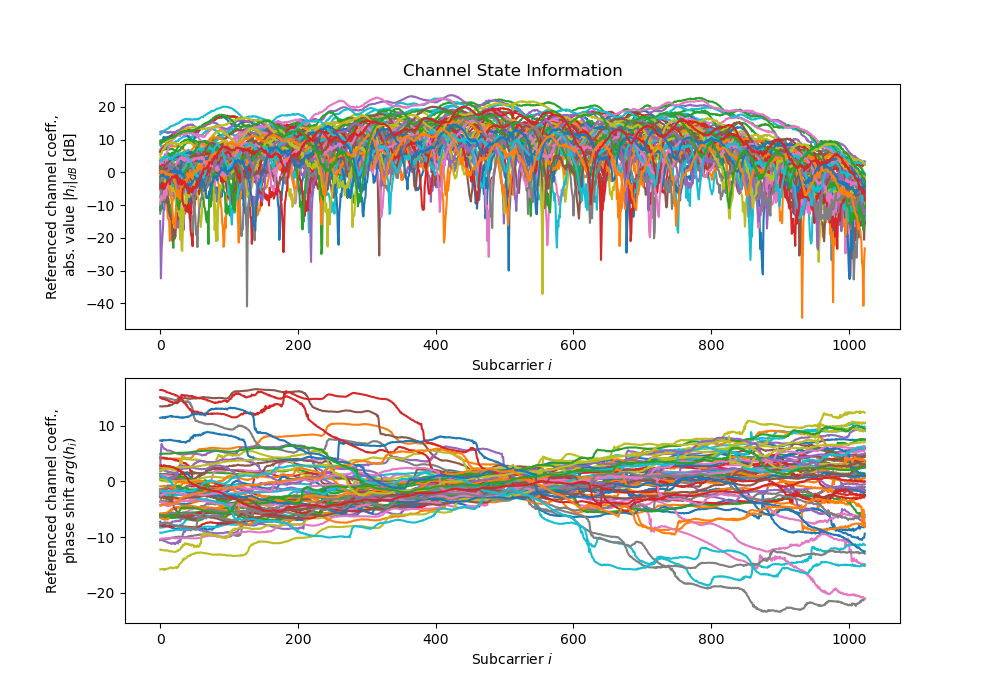
# Channel coefficients for all antennas, over all subcarriers, real and imaginary parts
csi = tf.ensure_shape(tf.io.parse_tensor(record["csi"], out_type = tf.float32), (64, 1024, 2))
# Time in seconds to closest known tachymeter position. Indicates quality of linear interpolation.
gt_interp_age_tachy = tf.ensure_shape(record["gt-interp-age-tachy"], ())
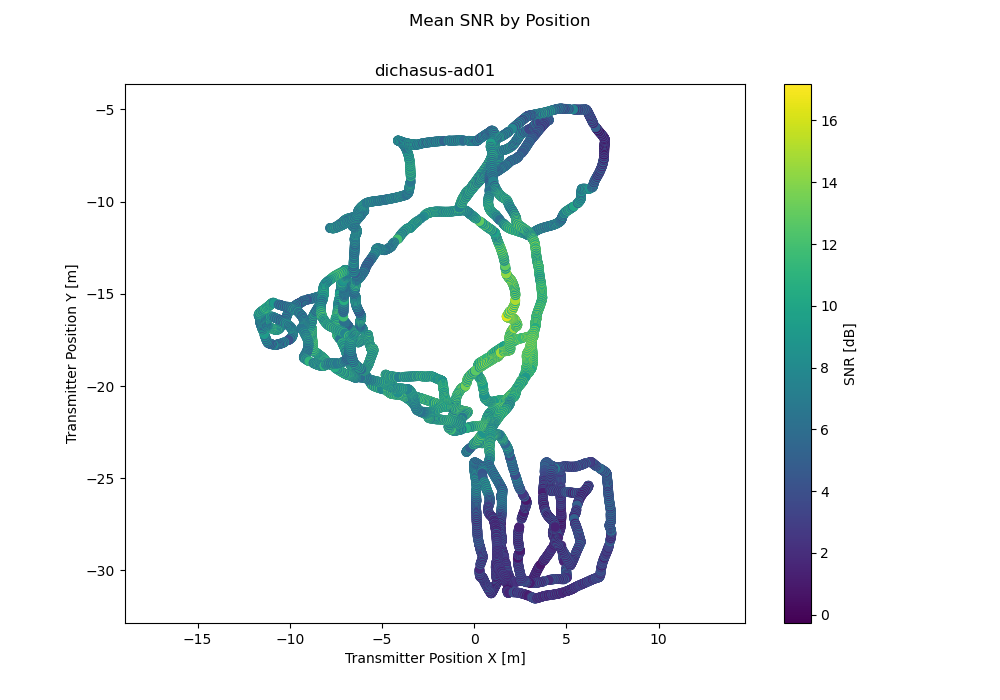
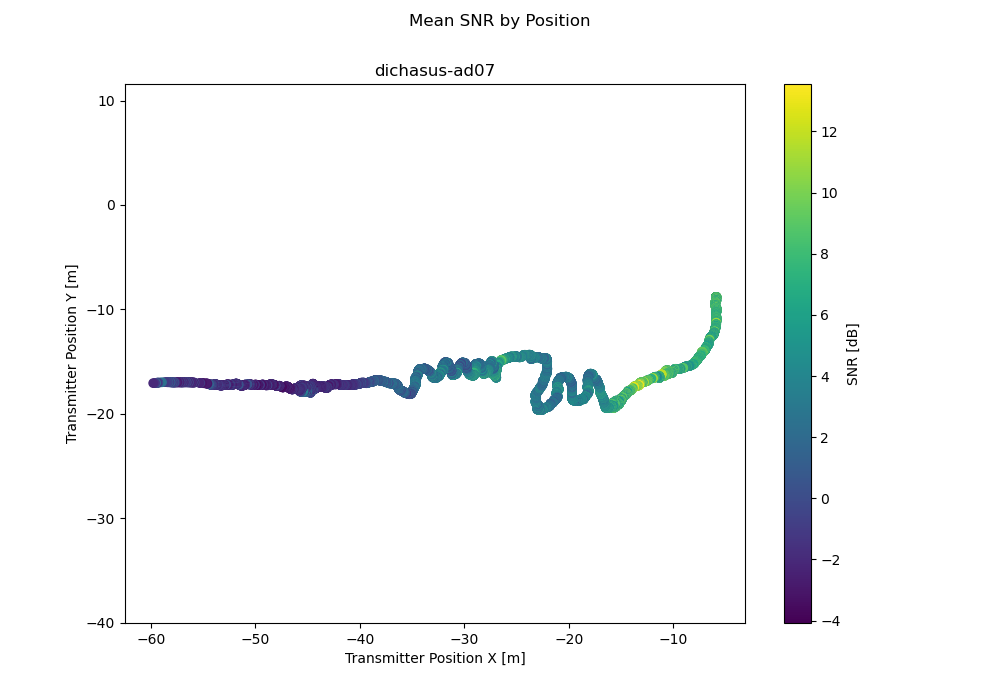
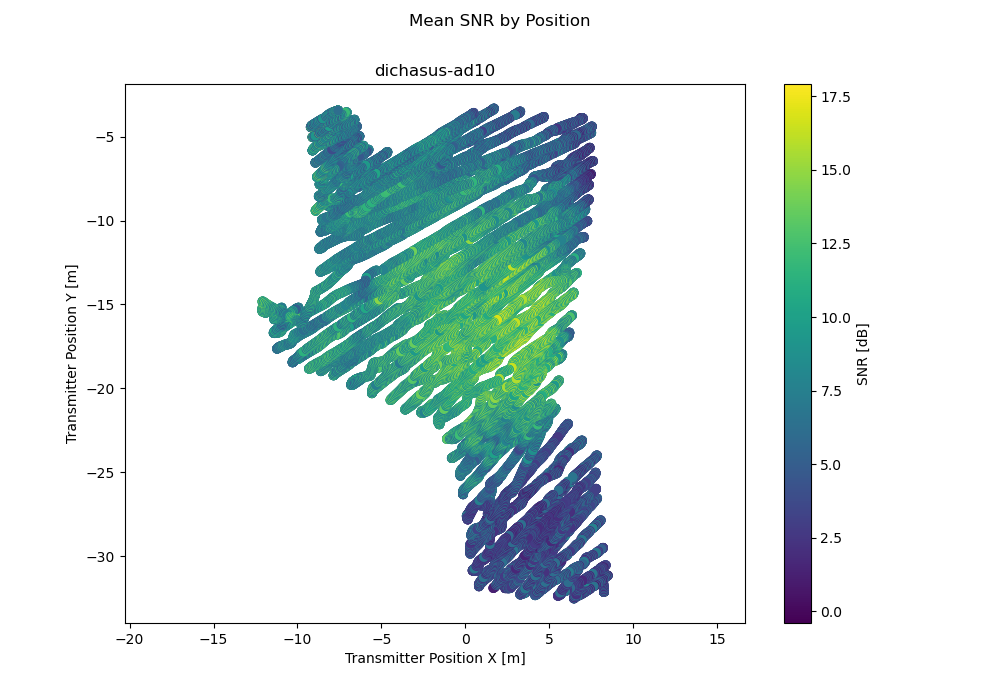
# Position of transmitter determined by a tachymeter pointed at a prism mounted on top of the antenna, in meters (X / Y / Z coordinates)
pos_tachy = tf.ensure_shape(tf.io.parse_tensor(record["pos-tachy"], out_type = tf.float64), (3))
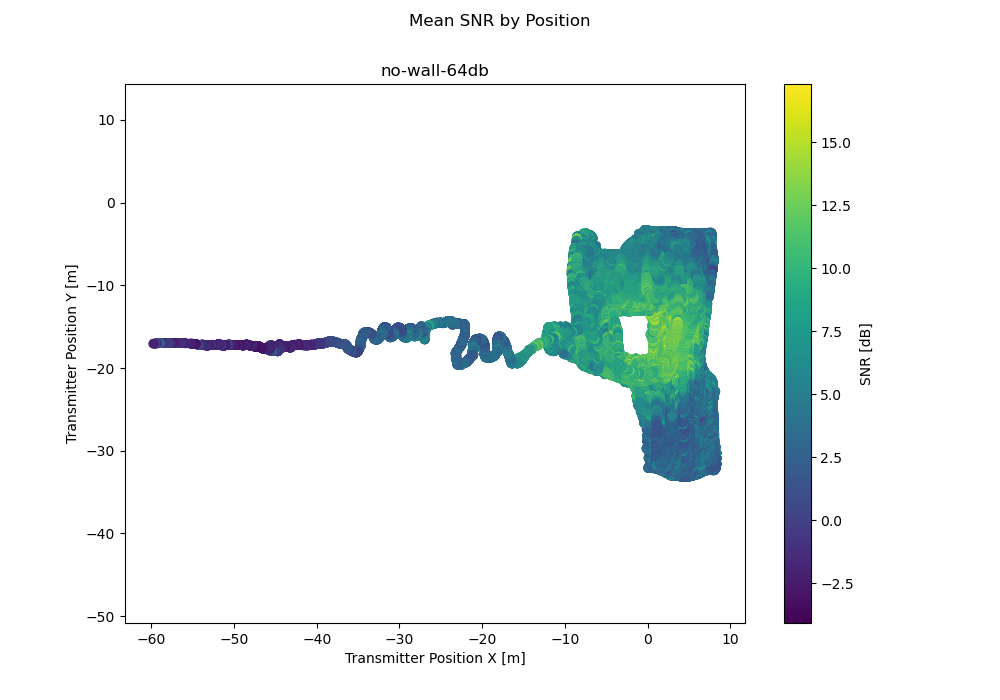
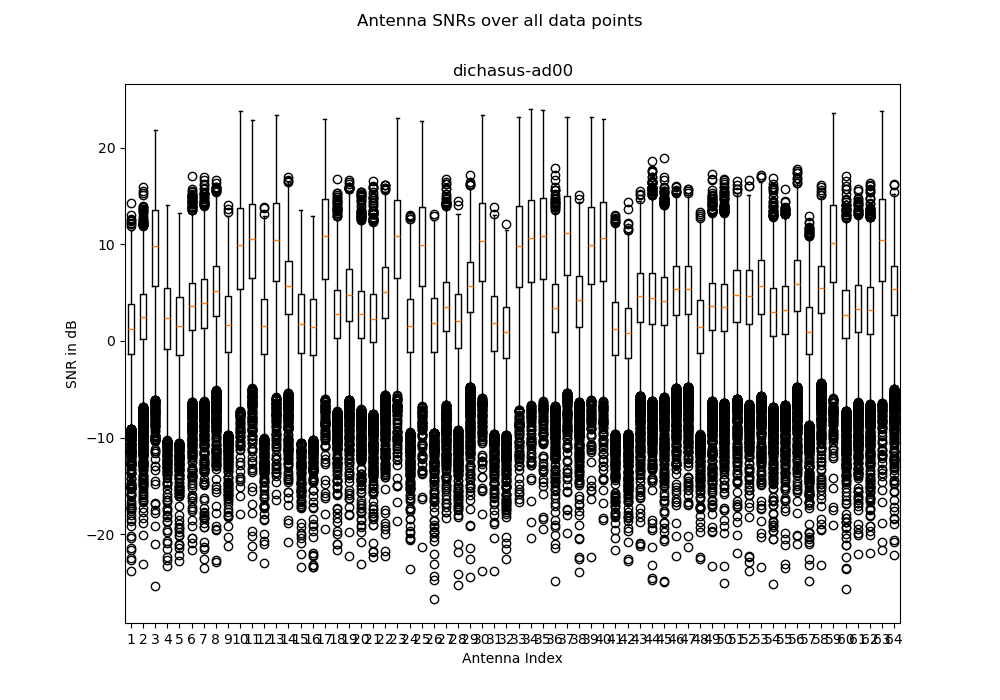
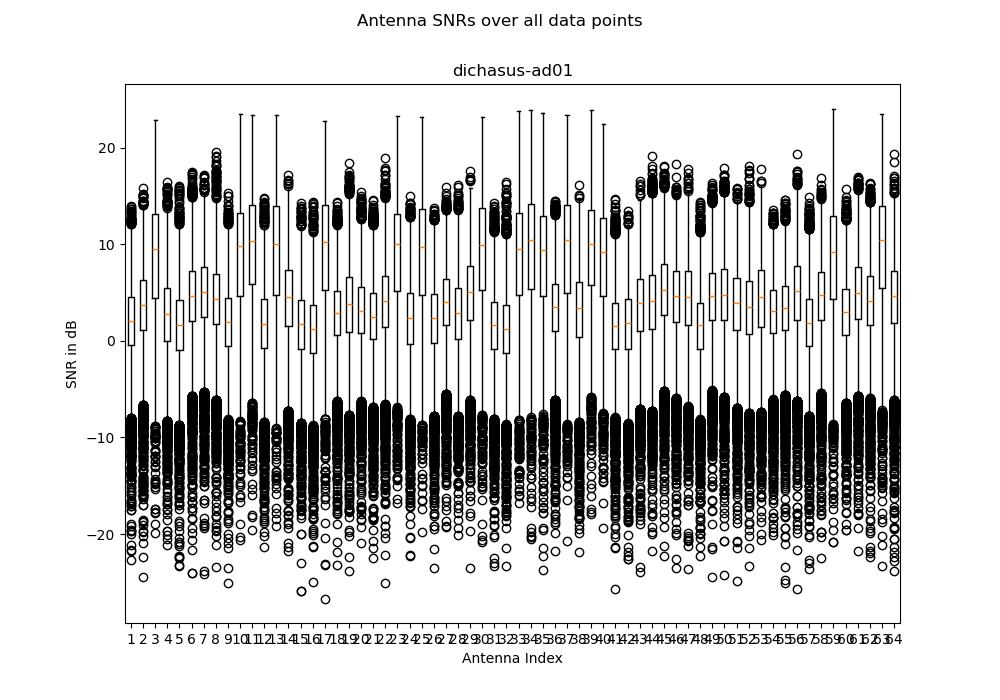
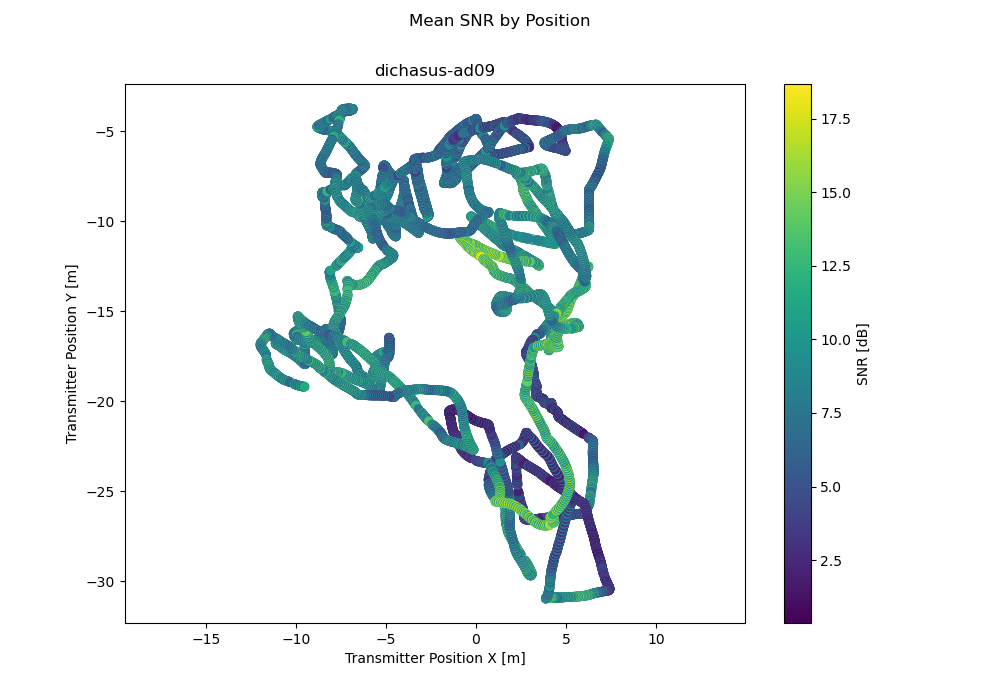
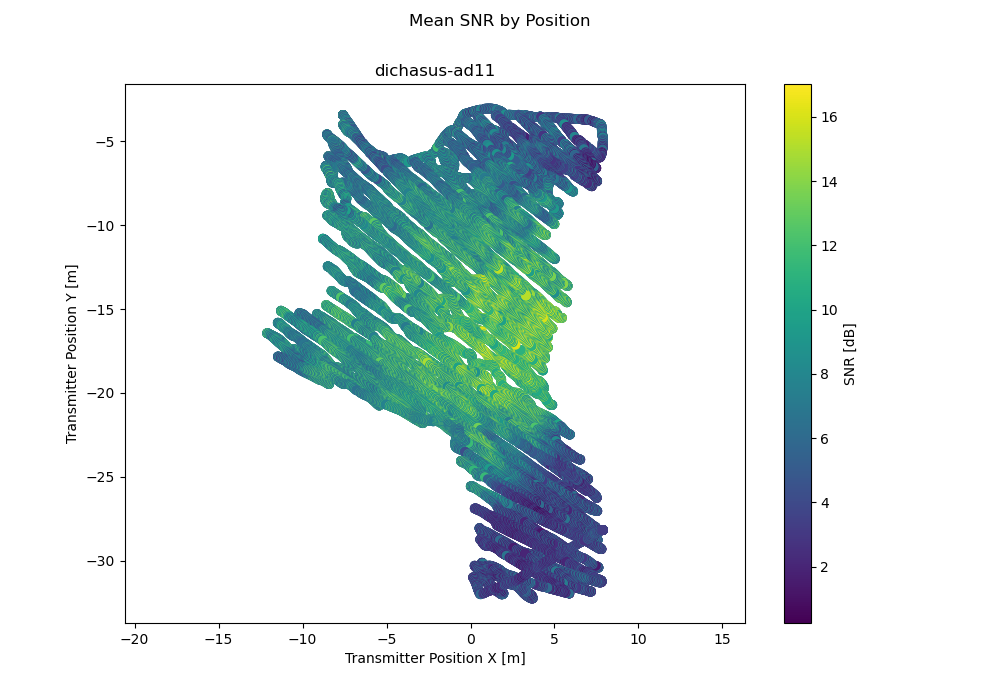
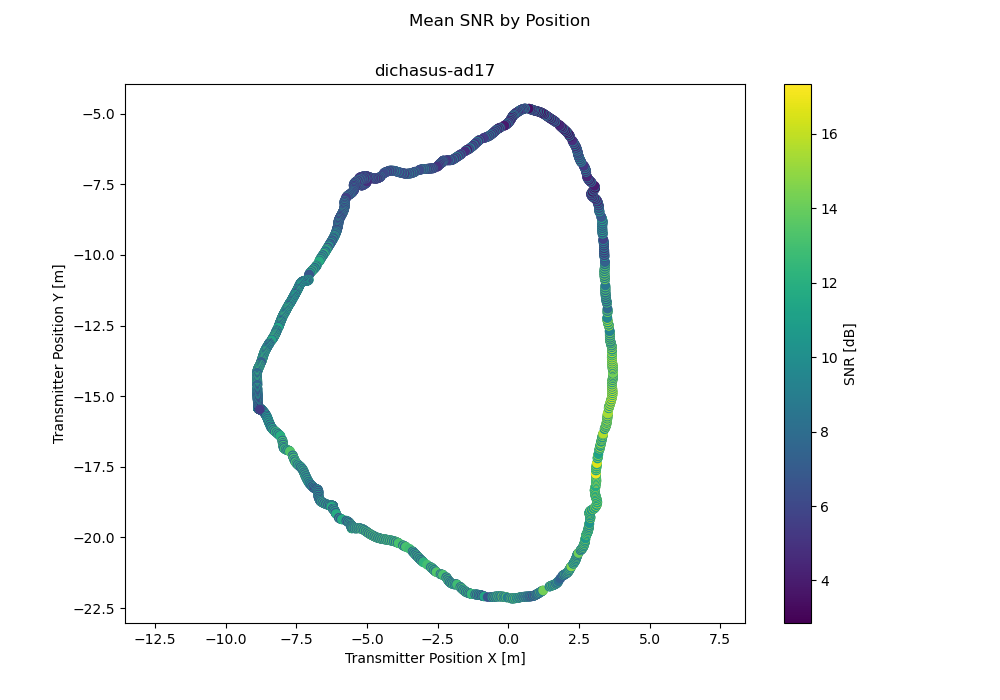
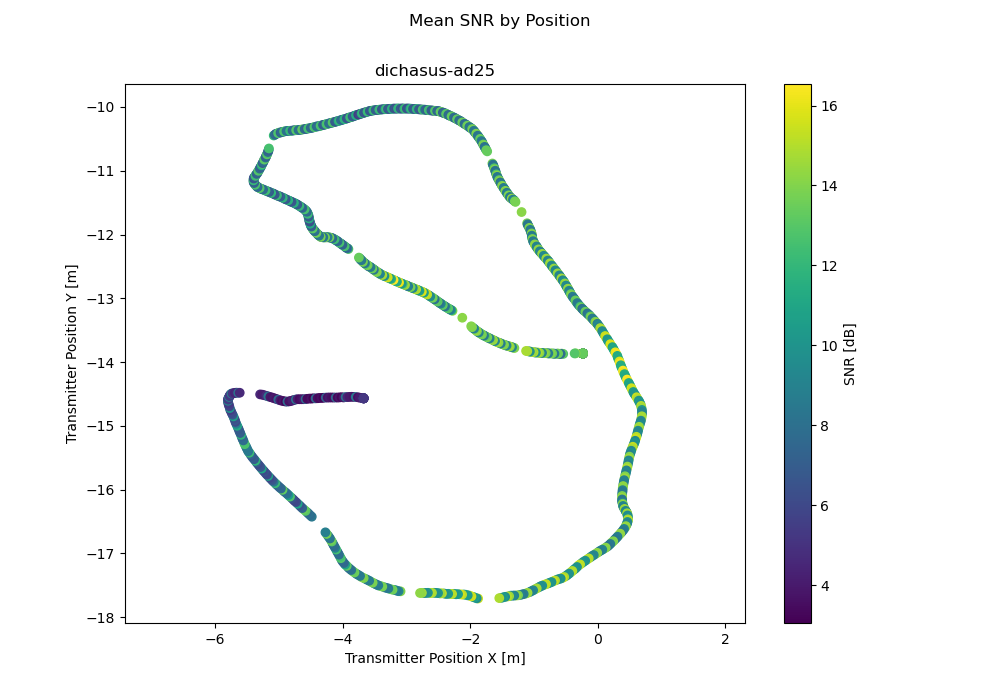
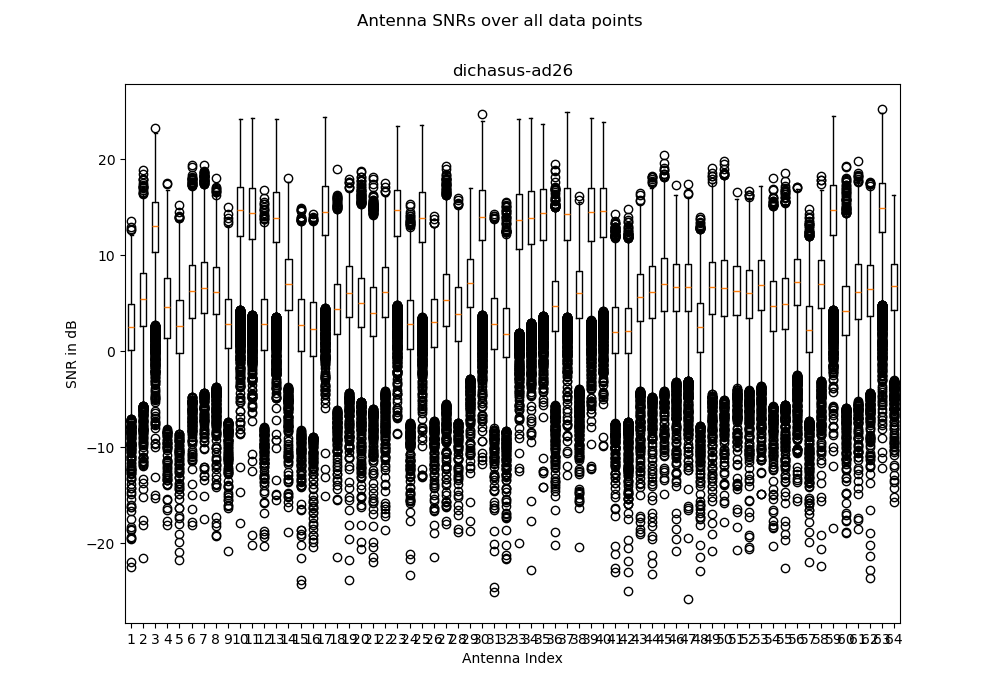
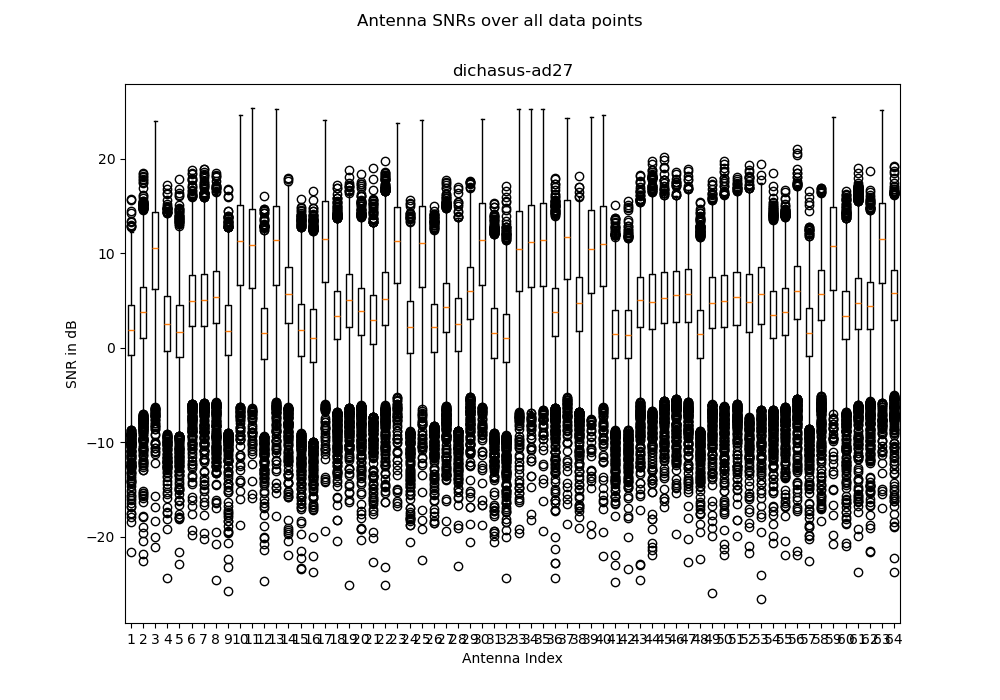
# Signal-to-Noise ratio estimates for all antennas
snr = tf.ensure_shape(tf.io.parse_tensor(record["snr"], out_type = tf.float32), (64))
# Timestamp since start of measurement campaign, in seconds
time = tf.ensure_shape(record["time"], ())
return cfo, csi, gt_interp_age_tachy, pos_tachy, snr, time
dataset = raw_dataset.map(record_parse_function, num_parallel_calls = tf.data.experimental.AUTOTUNE)
# Optional: Cache dataset in RAM for faster training
dataset = dataset.cache()Reference Channel Compensation
For this dataset, we are able to provide estimated antenna-specific carrier phase and sampling time offsets. These offsets occur due to the fact that the reference transmitter channel is not perfectly frequency-flat. To learn more about why these offsets occur and about their compensation, visit our offset calibration tutorial on this topic. Note that the estimates provided here are "best-effort" calculations. The phase and time offsets between antennas in the same array are usually very accurate, but for antennas that are spaced far apart, the results may be less precise. For this dataset, the reference transmitter channel seems to be somewhat unstable, i.e., phase and time offsets fluctuate over time. Therefore, we provide a file containing our phase and time offset estimates for each individual file in the dataset. You can download these estimates from the list of files below.Configuration Variants and Pointcloud
:
Pointcloud Download and Usage Instructions
For this dataset, we provide a pointcloud of the environment, which was generated using a 3D scanning device. You may find the pointcloud useful for visualization purposes or to reconstruct and verify 3D models. Pointclouds can be viewed and edited with applications like CloudCompare.
Two pointcloud scans, available for download as a .tar.xz file, were made for this dataset:
day1.pts: First pointcloud scan made after the first day of measurementsday2.pts: Pointcloud scan made during the second day of measurements. Note that the tachymeter (which acts as 3d scanner) is now placed at a different location. However, we made sure to provide all points in the same coordinate system.
Refer to the description of the configuration variants of the particular .tfrecords file to determine whether a particular measurement was made on the first or second day.
PTS files are simple text files with the following format:
- The first line contains the number of datapoints in the scan
- The other lines contain
(x, y, z)coordinates, reflection intensity and(r, g, b)color, e.g.:
x      y        z       i    r   g   b
6.9912 -19.5173 14.7111 -546 183 190 174
6.9930 -19.5178 14.7112 -505 162 171 154
6.9888 -19.5181 14.7098 -570 193 200 184
6.9902 -19.5111 14.7109 -578 184 191 173
Videos
This dataset includes .mkv videos of the environment / transmitter, each corresponding to individual .tfrecords dataset files..
You may want to use these videos to get a better understanding of what is going on in the environment, or for data visualization purposes.
The videos were synchronized to the dataset such that the first video frame is recorded at the same time that the earliest CSI datapoint contained in the dataset file is measured.
This way, by taking into account the CSI timestamps, you can match the video frames to the CSI measurements.
Please note that the earliest datapoint in the file may not be the one that appears first in the .tfrecords file, since the temporal order of the datapoints is not guaranteed.
The duration of the video should be approximately equal to the duration of the .tfrecords file (i.e., earliest timestamp subtracted from last timestamp).
The synchronization should be accurate down to 1-2 video frames.
How to Cite
Please refer to the home page for information on how to cite any of our datasets in your research. For this dataset in particular, you may use the following BibTeX:
@data{dataset-dichasus-adxx,
	author    = {Euchner, Florian and Stephan, Phillip and Gauger, Marc and ten Brink, Stephan},
	publisher = {DaRUS},
	title     = {{CSI Dataset dichasus-adxx: ARENA2036: Distributed setup in industrial environment at 3.4GHz}},
	doi       = {doi:10.18419/darus-4062},
	url       = {https://doi.org/doi:10.18419/darus-4062},
	year      = {2024}
}
Download
This dataset consists of 27 files. Descriptions of these files as well as download links are provided below.
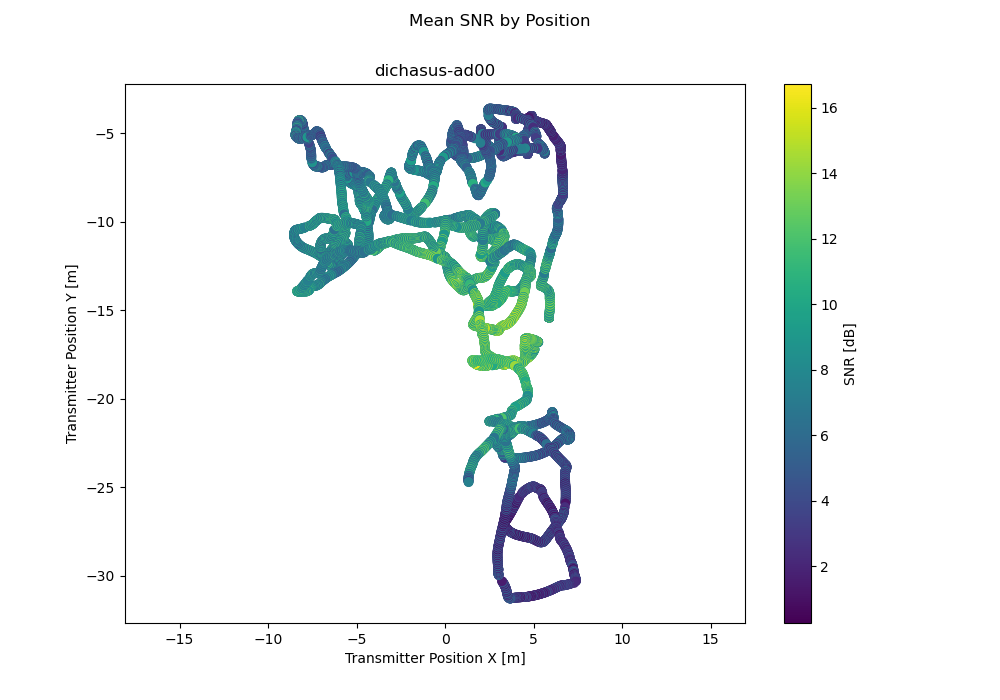
dichasus-ad00
Robot follows a pseudorandom trajectory in the measurement area, part 1.
File Size
Points
Duration
dichasus-ad01
Robot follows a pseudorandom trajectory in the measurement area, part 2.
File Size
Points
Duration

dichasus-ad02
Robot follows a pattern of west / east meanders in the whole measurement area.
File Size
Points
Duration
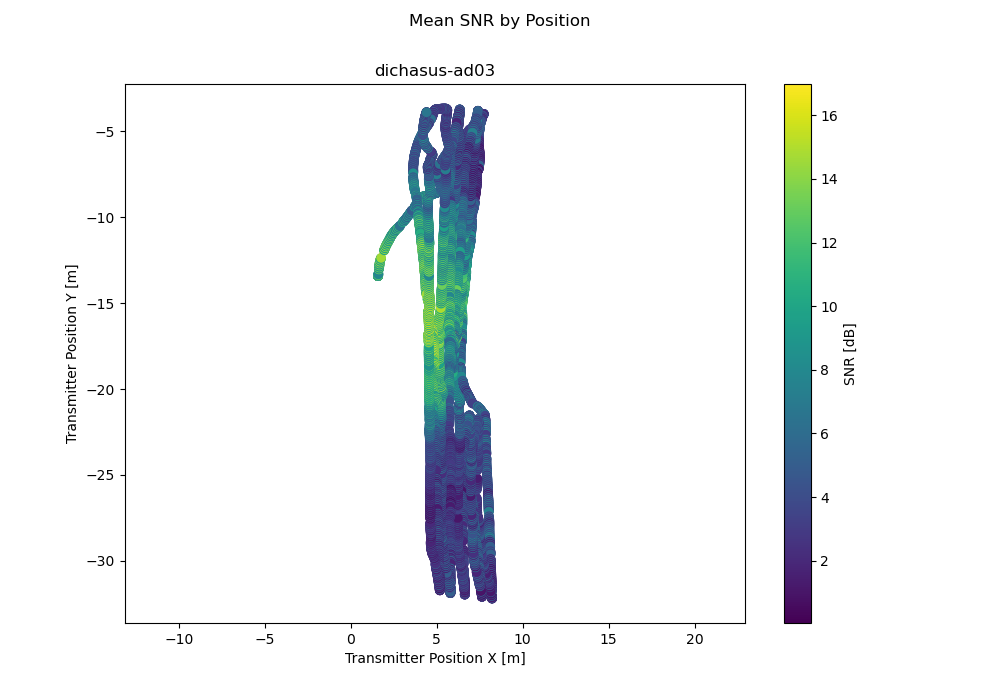
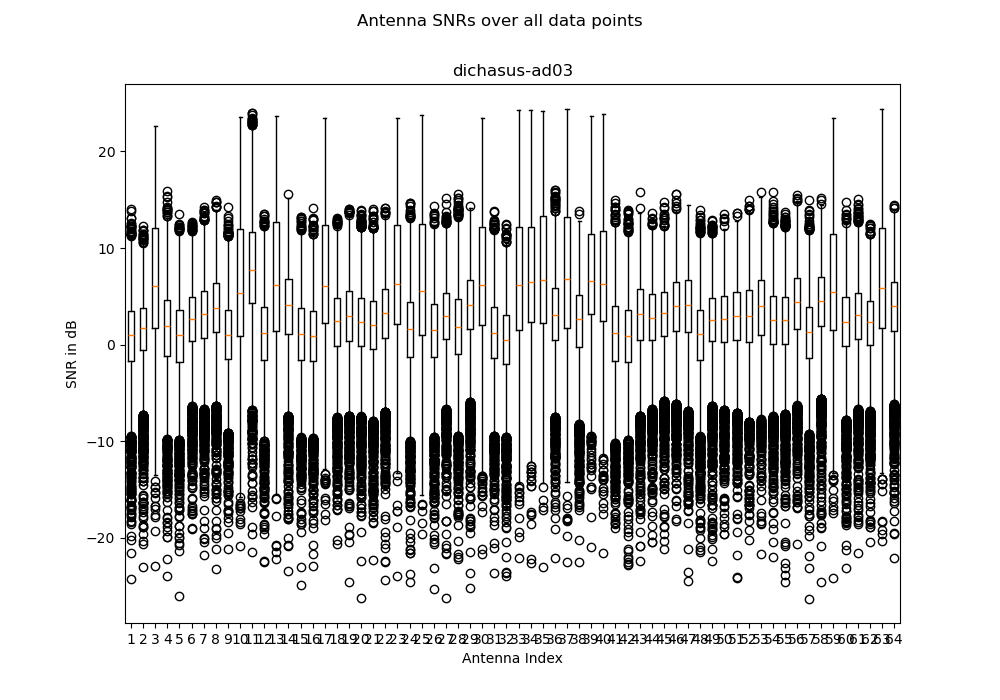
dichasus-ad03
Robot follows a short pattern of north / south meanders.
File Size
Points
Duration
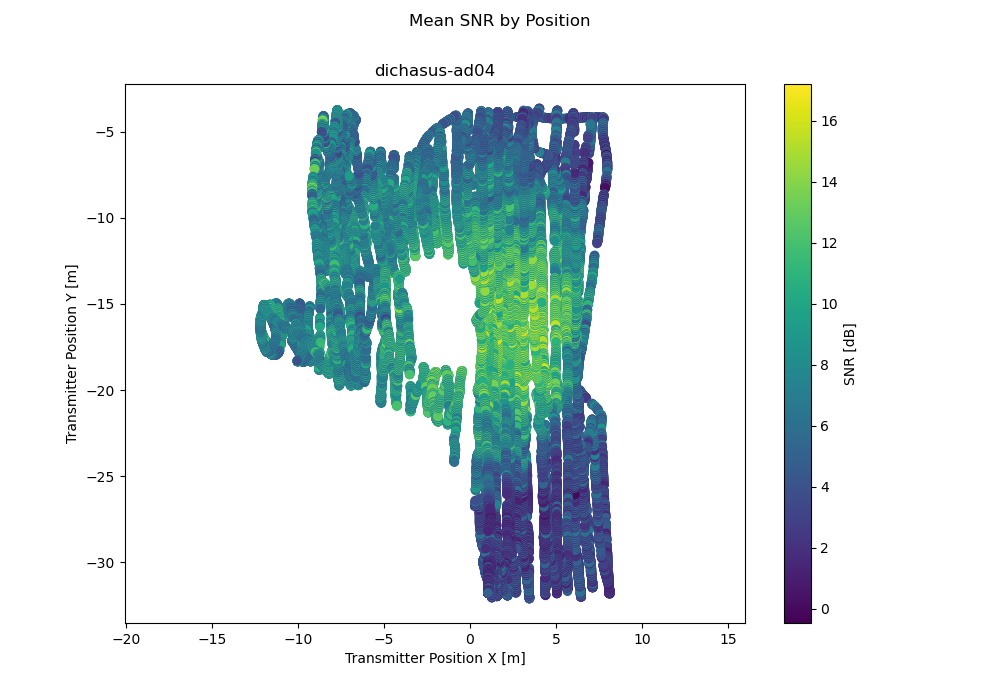
dichasus-ad04
Robot follows a (long) pattern of north / south meanders in the whole measurement area. A few datapoints in the middle may be missing (due to a tachymeter issue).
File Size
Points
Duration
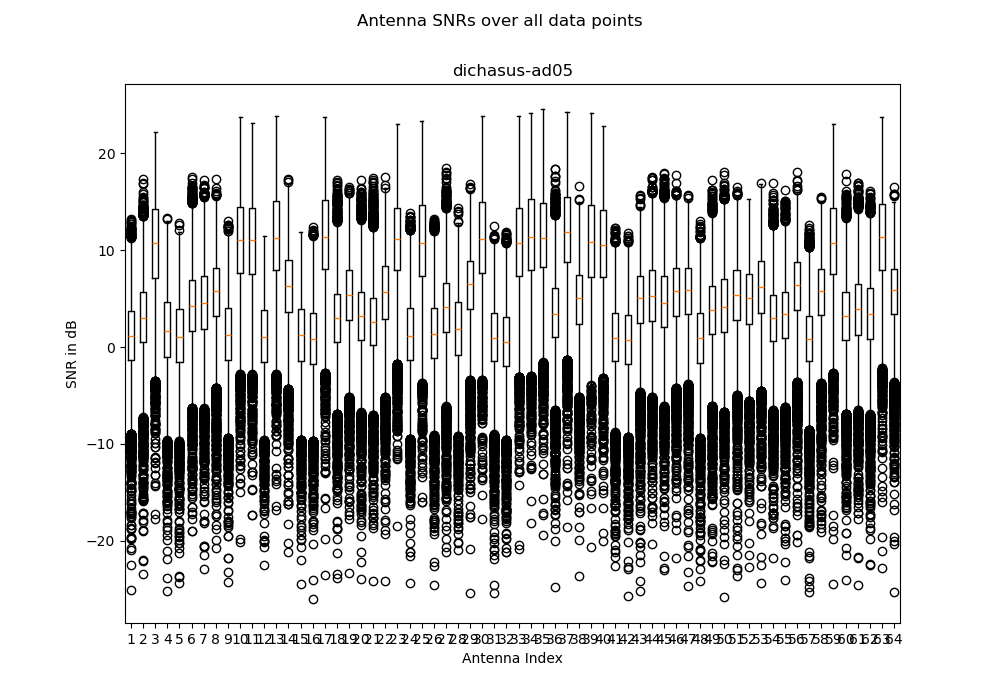
dichasus-ad05
Robot follows a long, pseudorandom 'smooth' trajectory in in the measurement area (part 1).
File Size
Points
Duration

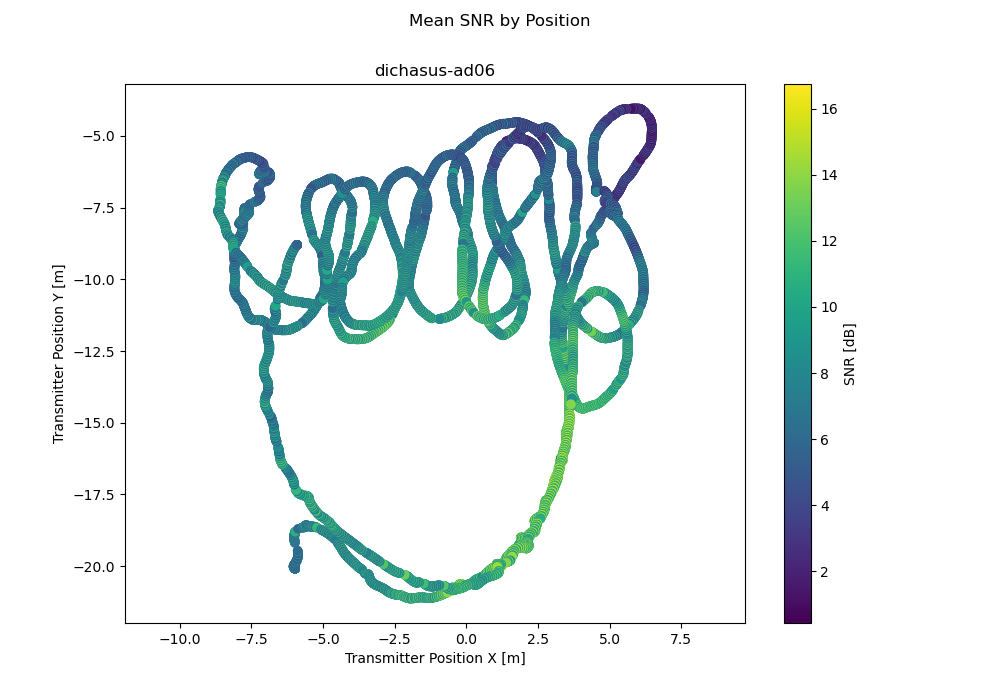
dichasus-ad06
Robot follows a long, pseudorandom 'smooth' trajectory in in the measurement area (part 2).
File Size
Points
Duration
dichasus-ad07
Robot leaves measurement area and ventures further back into the ARENA2036.
File Size
Points
Duration
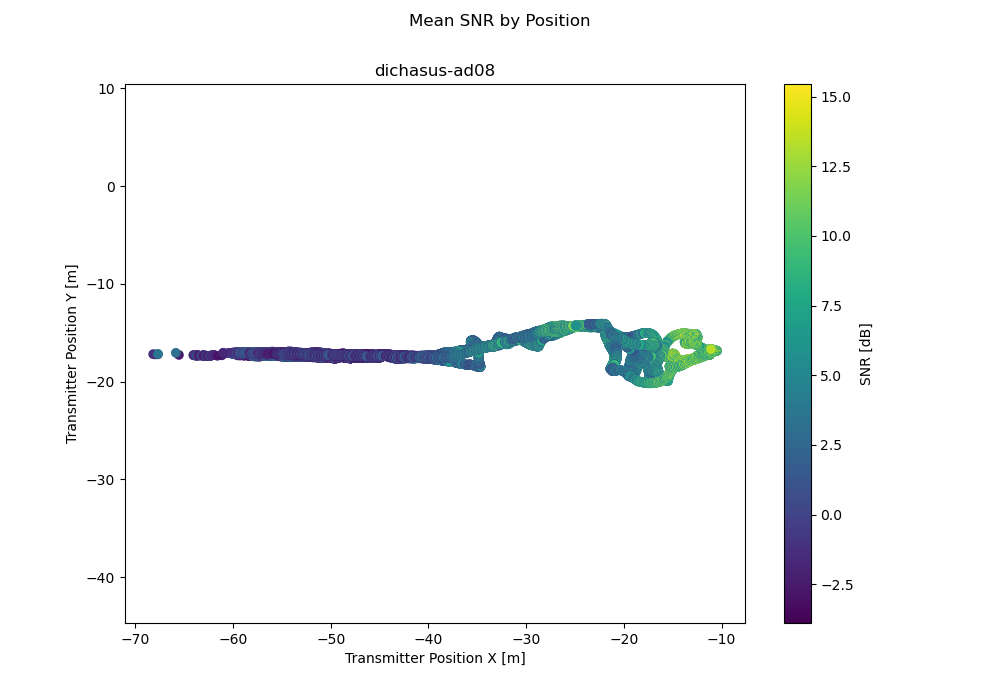
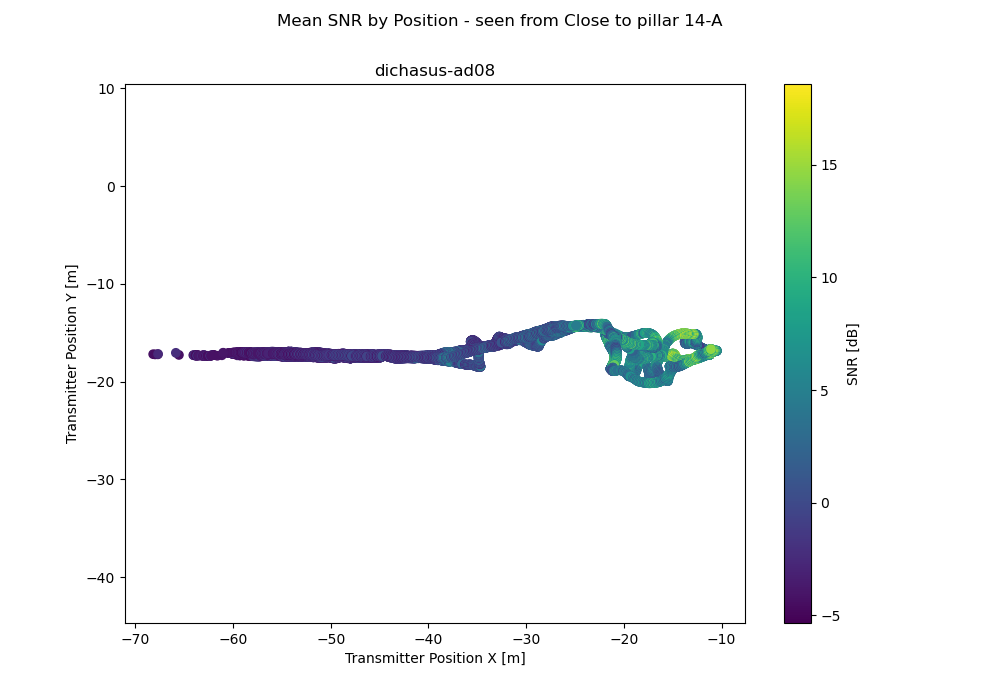
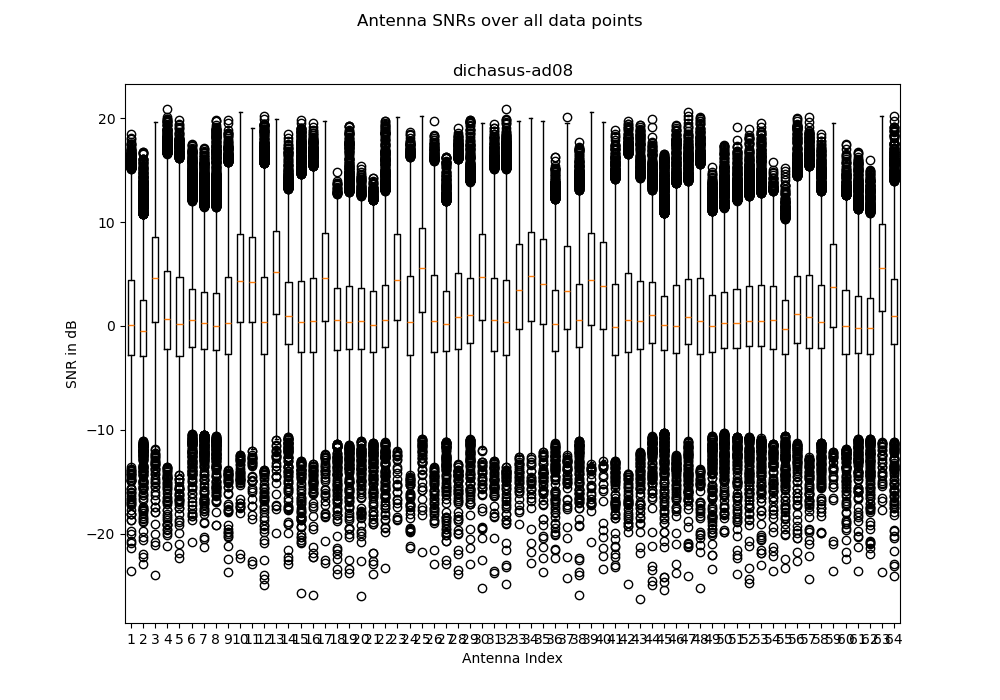
dichasus-ad08
Robot leaves measurement area and ventures further back into the ARENA2036, this time with higher receiver gain.
File Size
Points
Duration


dichasus-ad09
Robot follows a pseudorandom trajectory in the whole measurement area.
File Size
Points
Duration


dichasus-ad10
Robot follows a pattern of northeast / southwest meanders in the whole measurement area.
File Size
Points
Duration
dichasus-ad11
Robot follows a pattern of northwest / southeast meanders in the whole measurement area.
File Size
Points
Duration
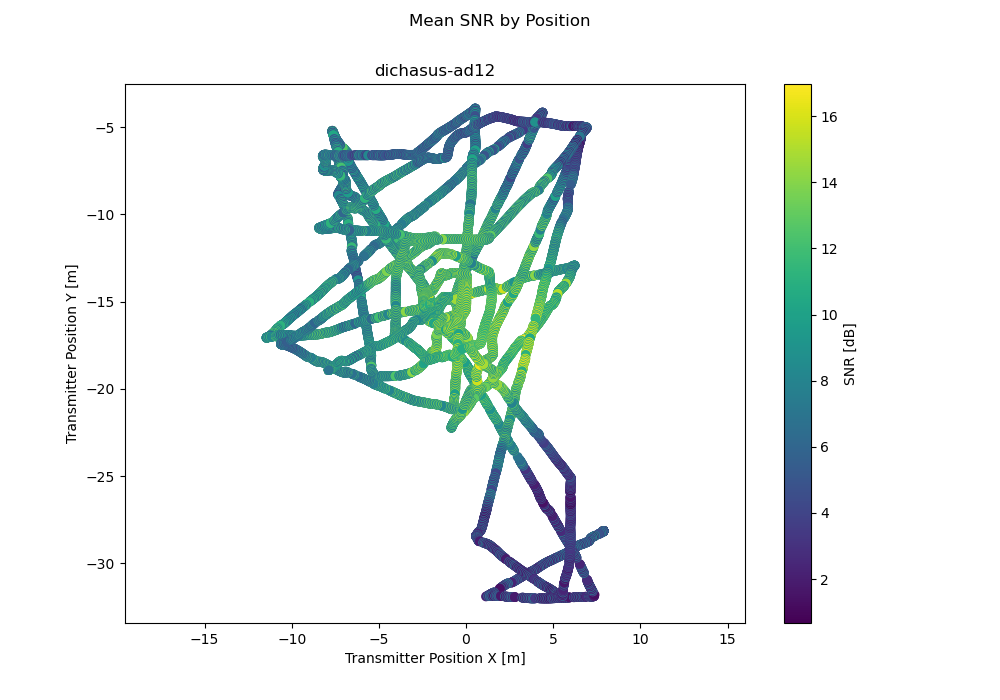
dichasus-ad12
Robot follows a pattern of northwest / southeast meanders in the whole measurement area.
File Size
Points
Duration
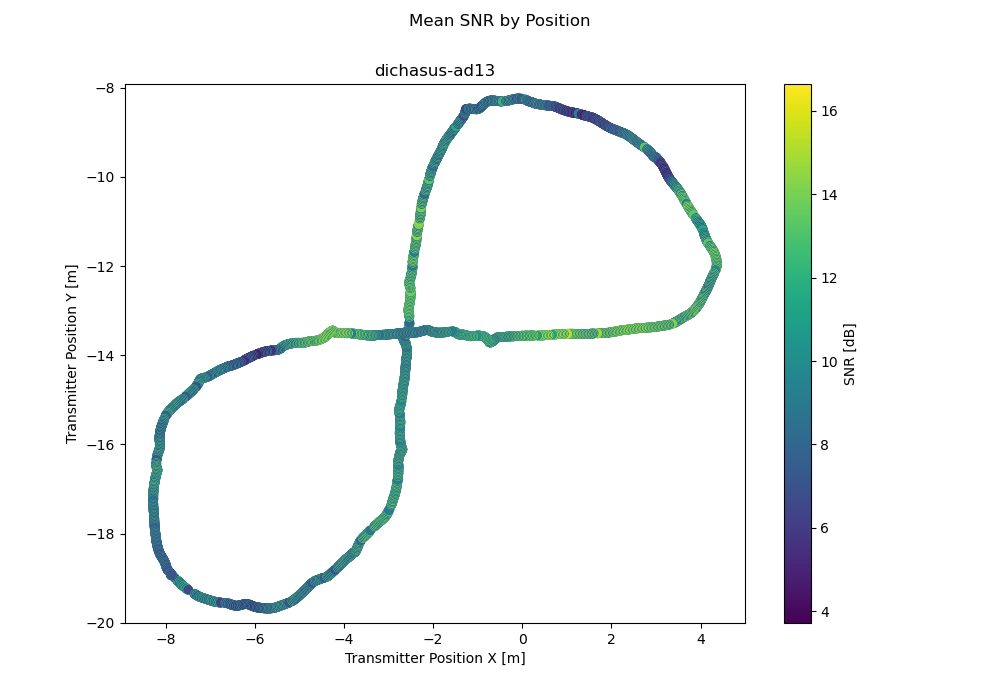
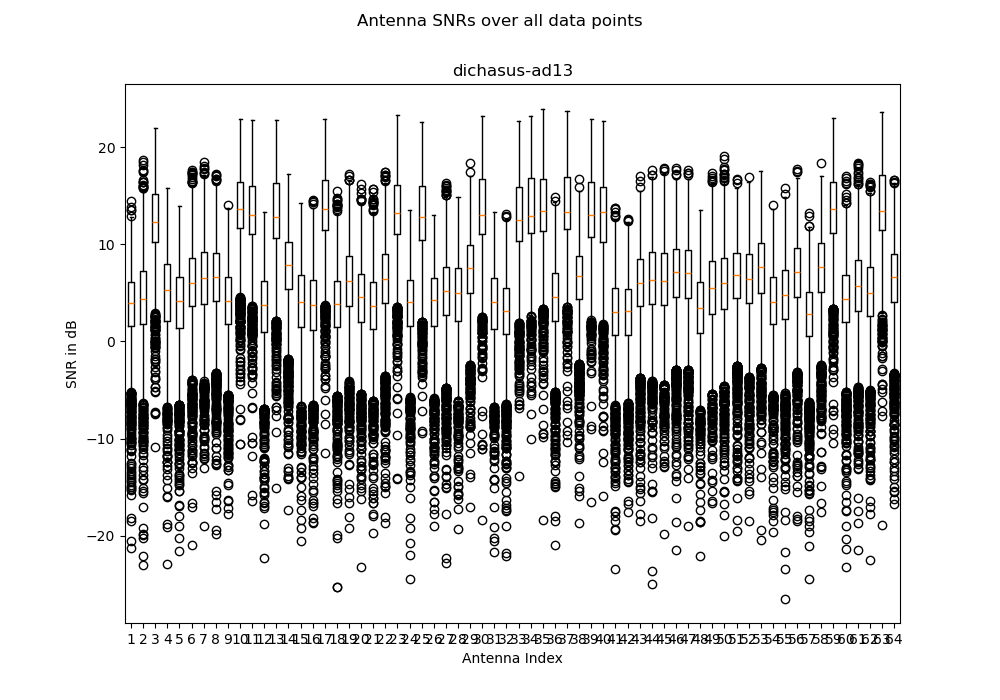
dichasus-ad13
Robot follows a figure 8-trajectory in the measurement area.
File Size
Points
Duration

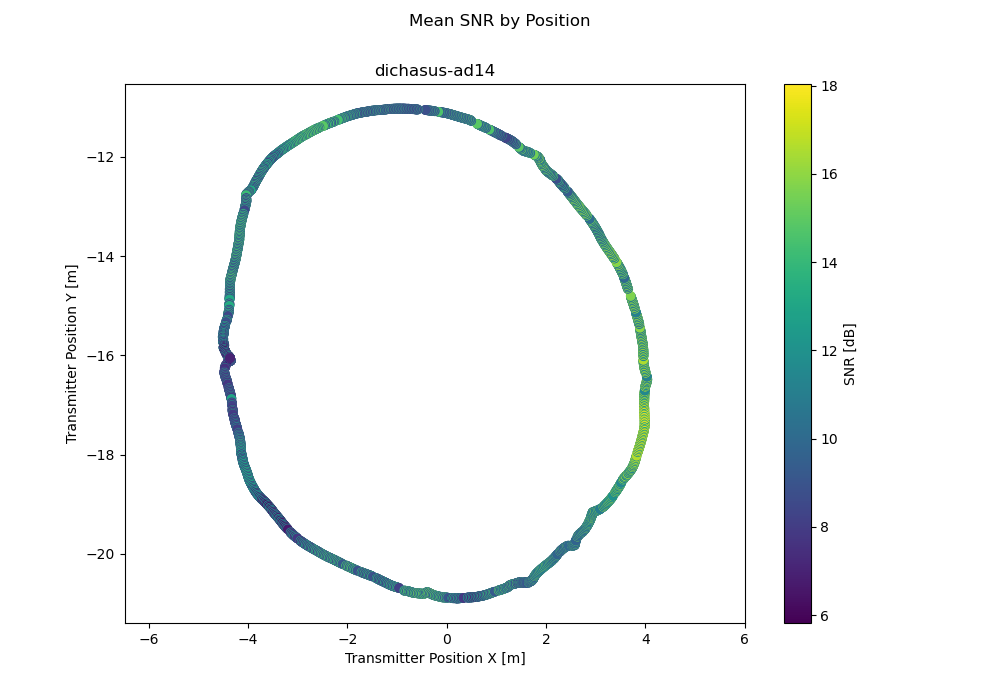
dichasus-ad14
Robot follows a circular trajectory in the measurement area.
File Size
Points
Duration
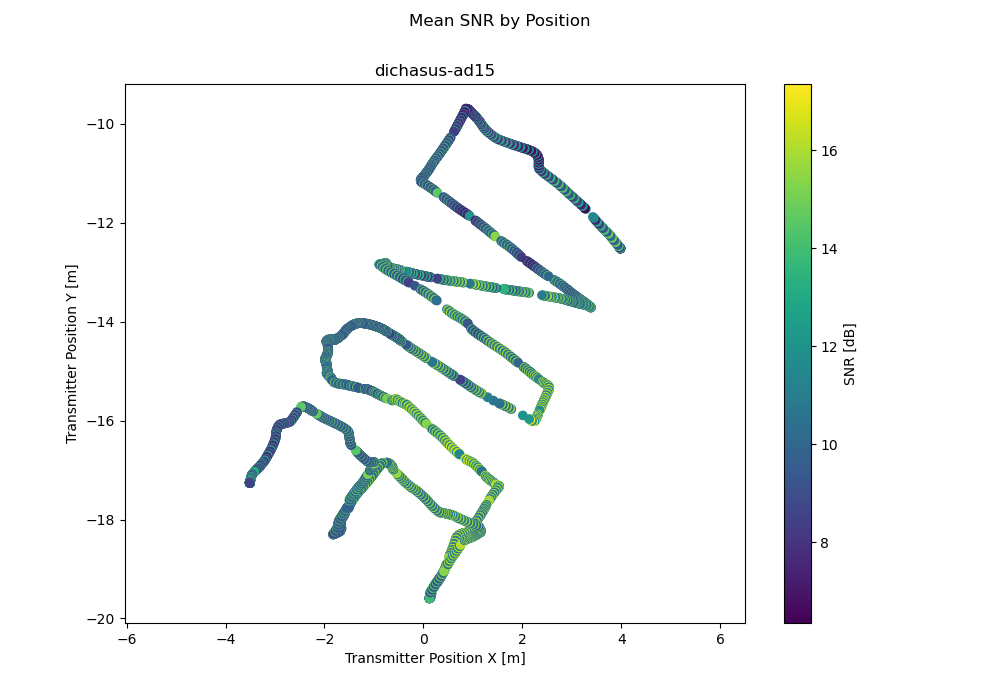
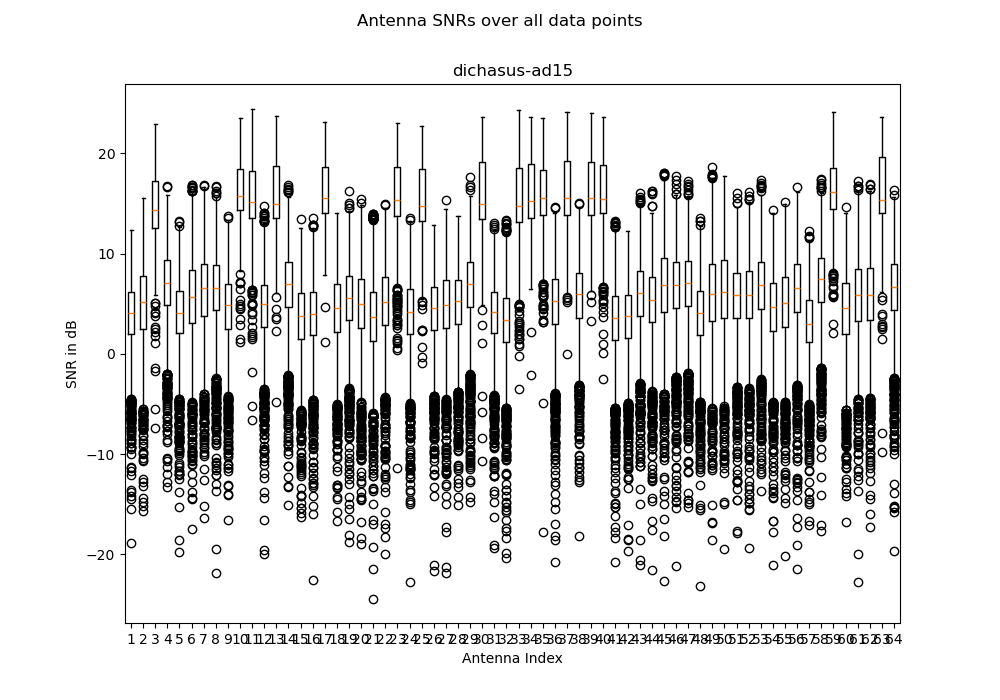
dichasus-ad15
Robot follows a trajectory in the shape of the letters 'INUE'. Person walking close to the measurement area. Letters are a bit wobbly.
File Size
Points
Duration

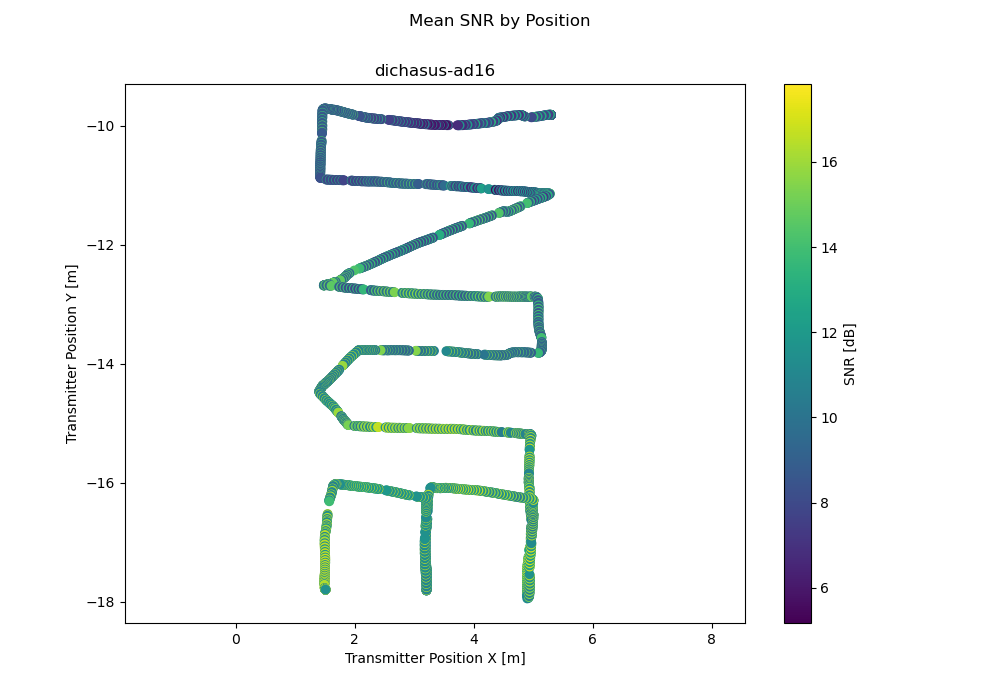
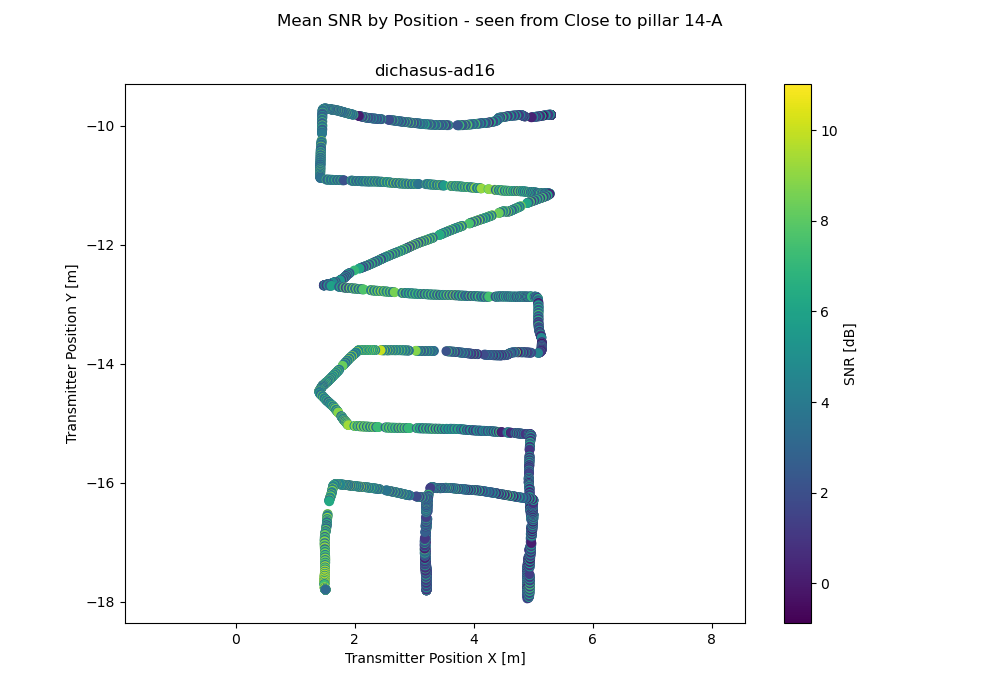
dichasus-ad16
Robot follows a trajectory in the shape of the letters 'INUE'.
File Size
Points
Duration
dichasus-ad17
Robot trajectory is in the shape of a large (slightly wobbly) circle.
File Size
Points
Duration
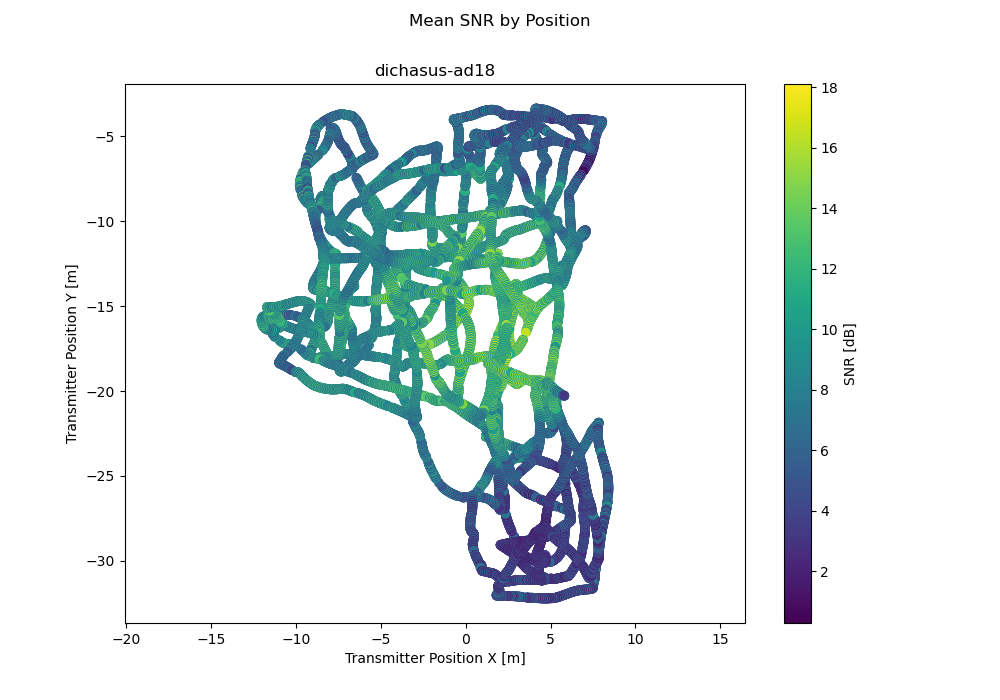
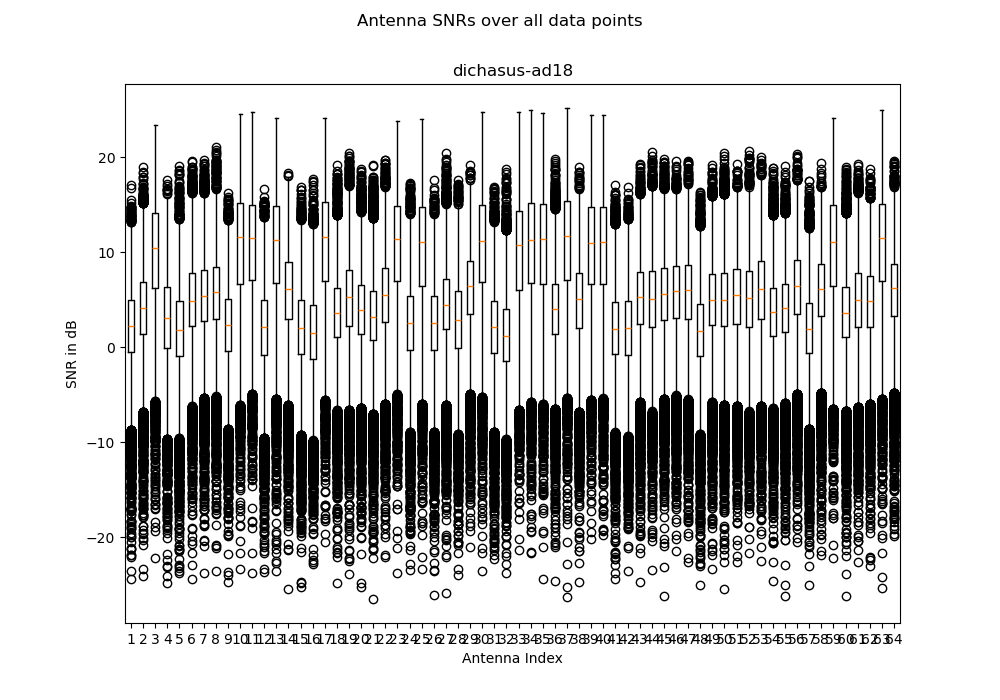
dichasus-ad18
Robot follows a pseudorandom trajectory in the entire measurement area, part 1.
File Size
Points
Duration
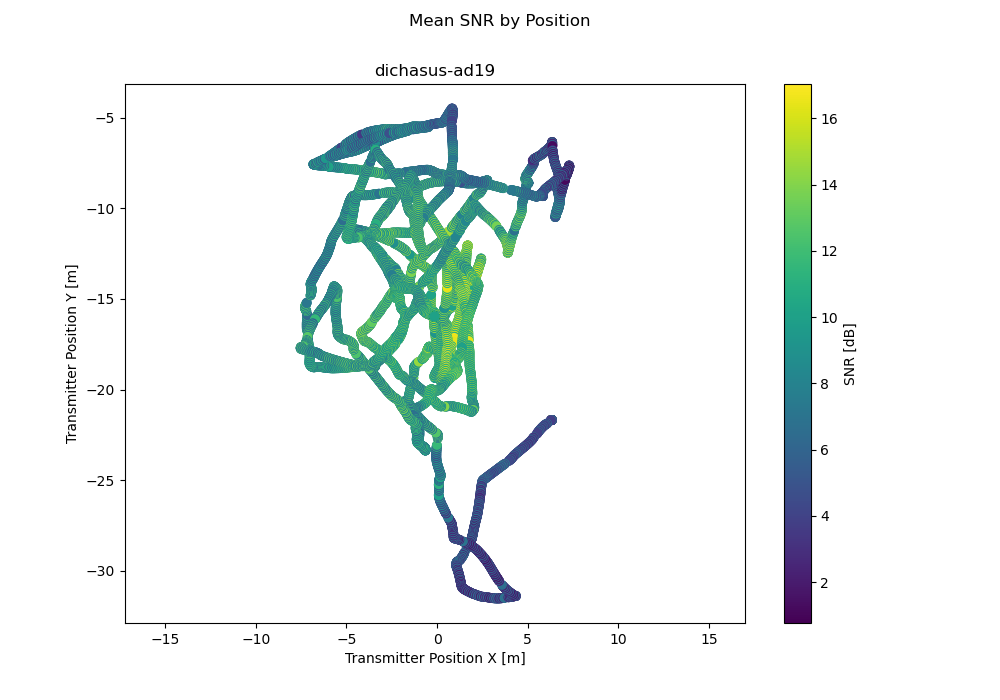
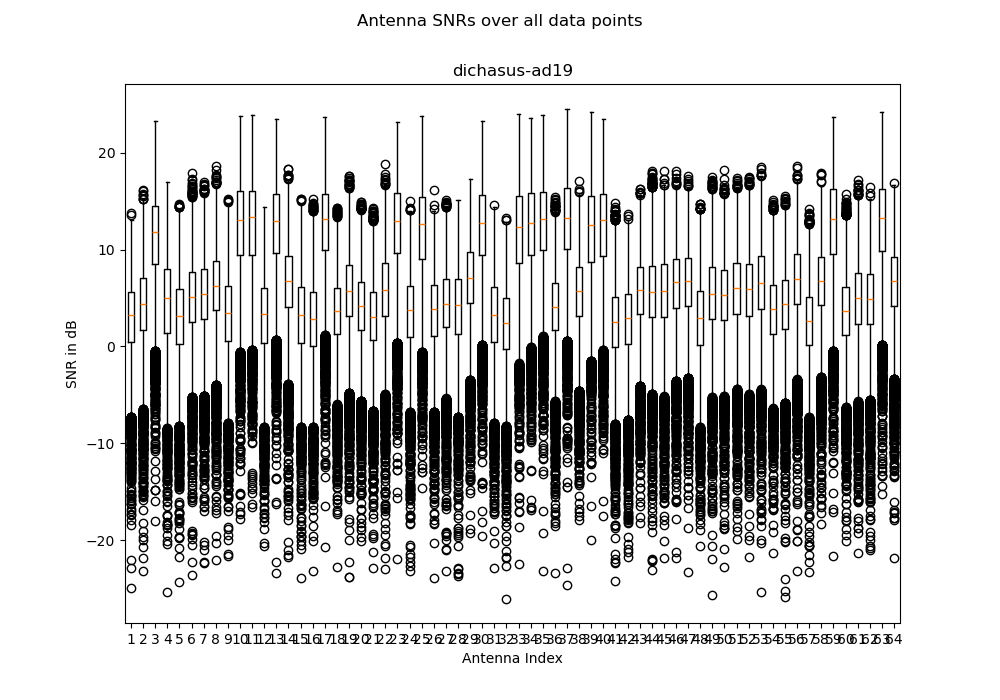
dichasus-ad19
Robot follows a pseudorandom trajectory in the entire measurement area, part 2.
File Size
Points
Duration
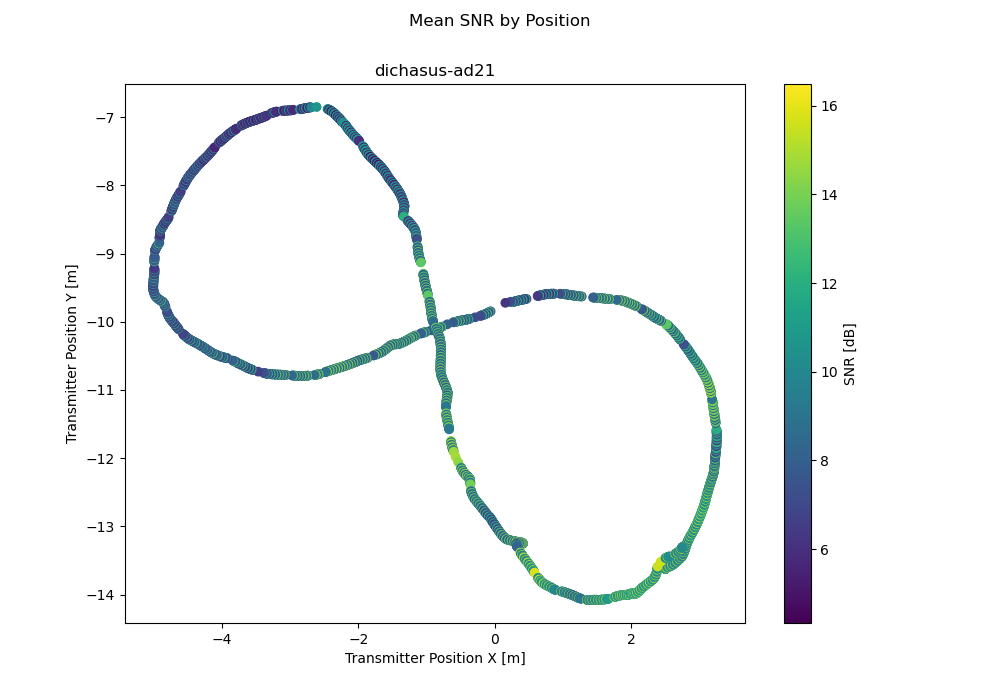
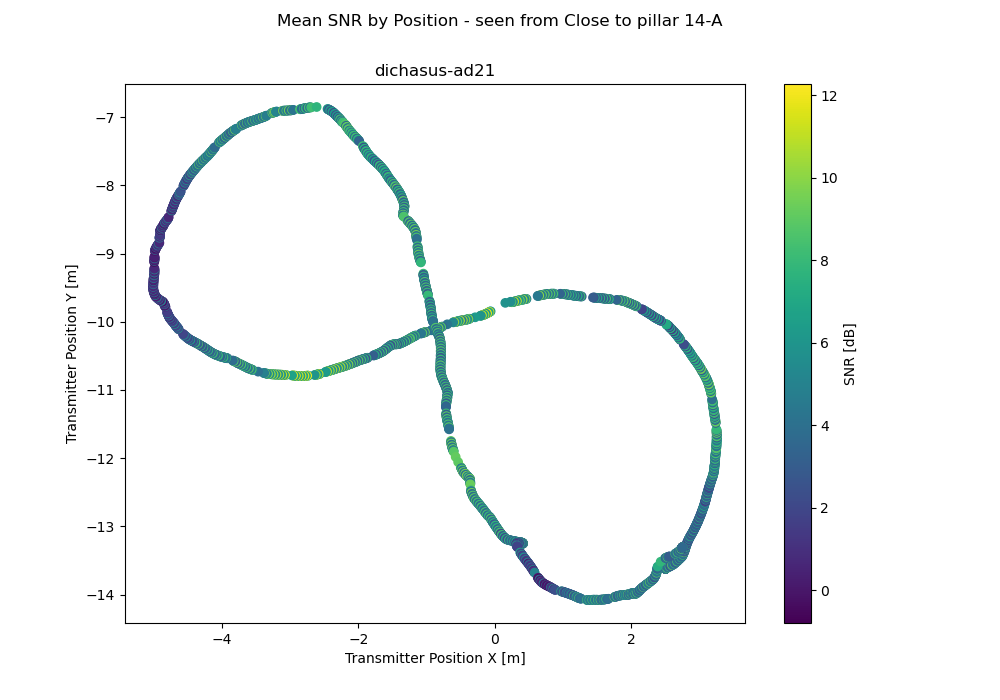
dichasus-ad21
Robot follows a figure 8-trajectory in the measurement area, the LoS to the antenna on top of the container is obstructed for parts of the trajectory.
File Size
Points
Duration

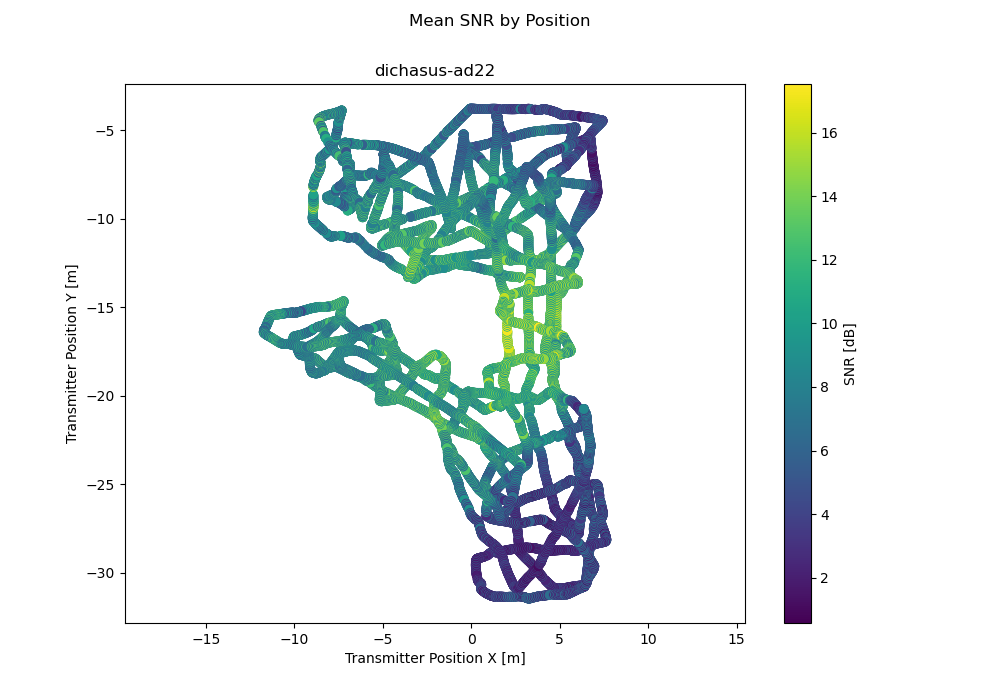
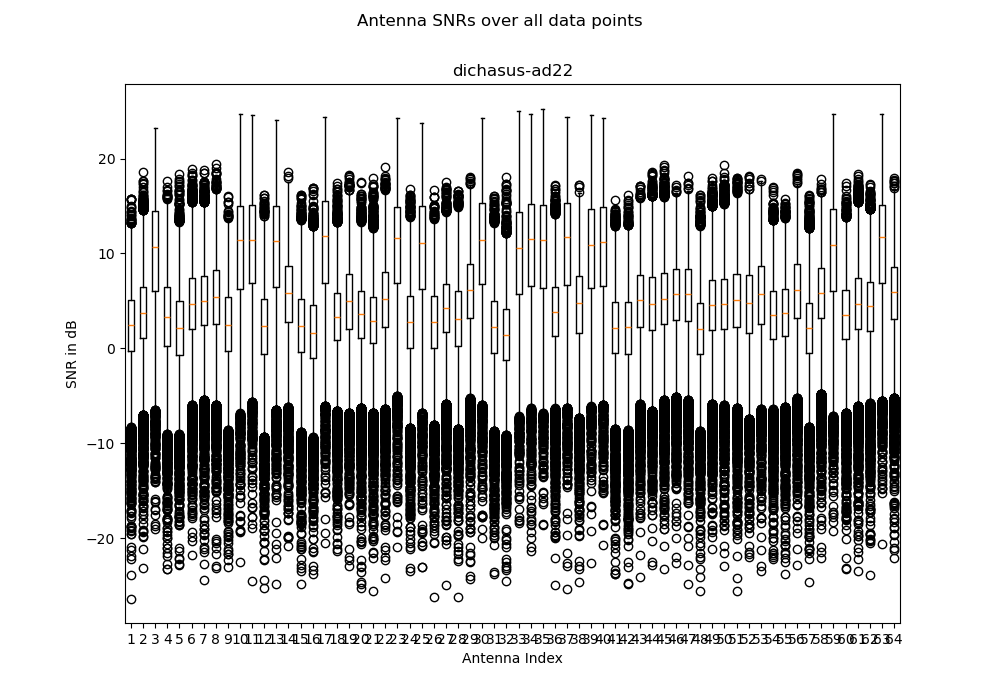
dichasus-ad22
Robot follows a pseudorandom trajectory, part 1.
File Size
Points
Duration
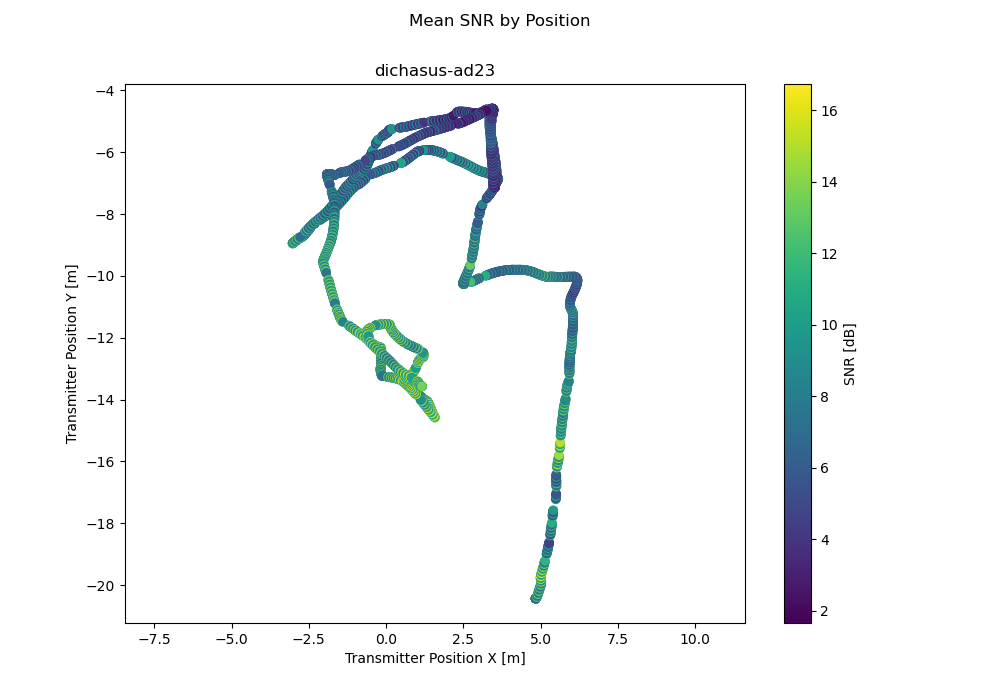
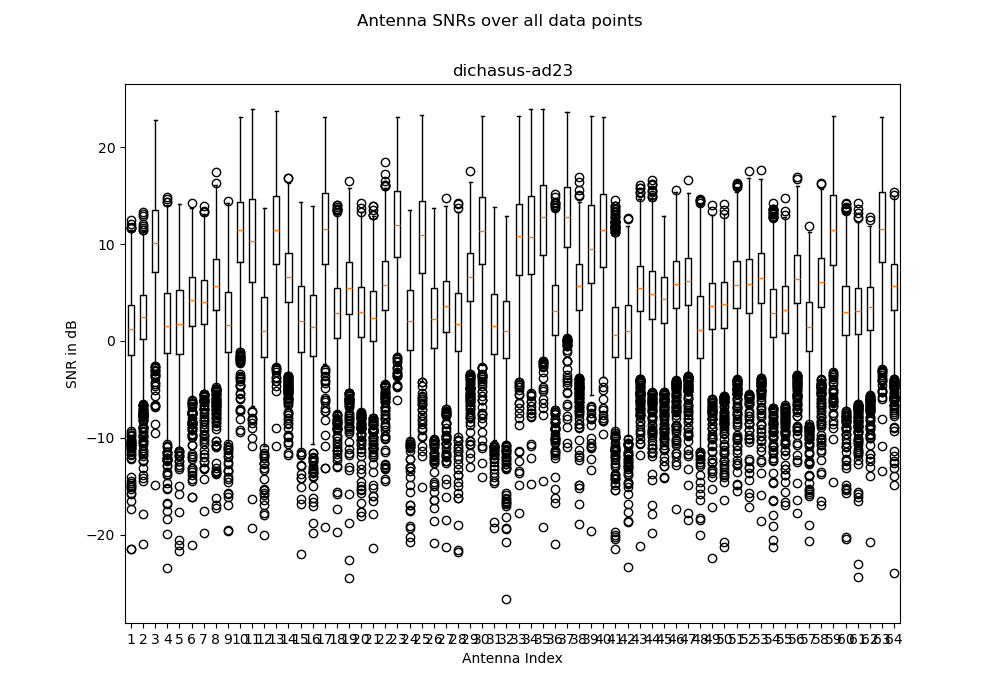
dichasus-ad23
Robot follows a pseudorandom trajectory, part 2.
File Size
Points
Duration
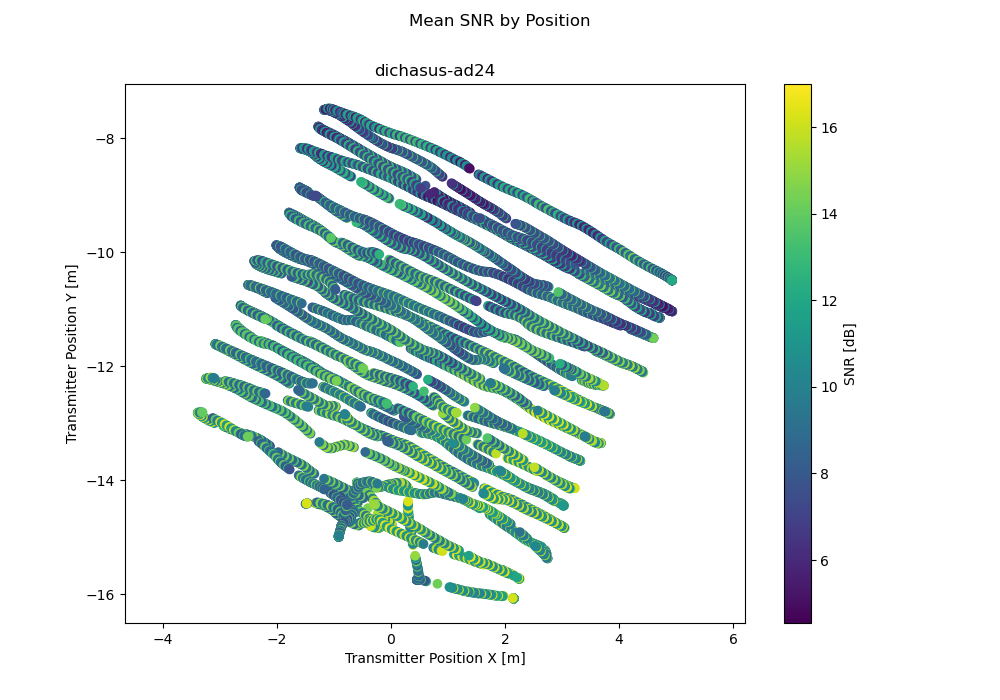
dichasus-ad24
Robot follows a meandering trajectory behind the metallic wall. LoS partially obstructed for antenna on top of container.
File Size
Points
Duration
dichasus-ad25
Short trajectory behind the metallic wall, higher robot speed.
File Size
Points
Duration
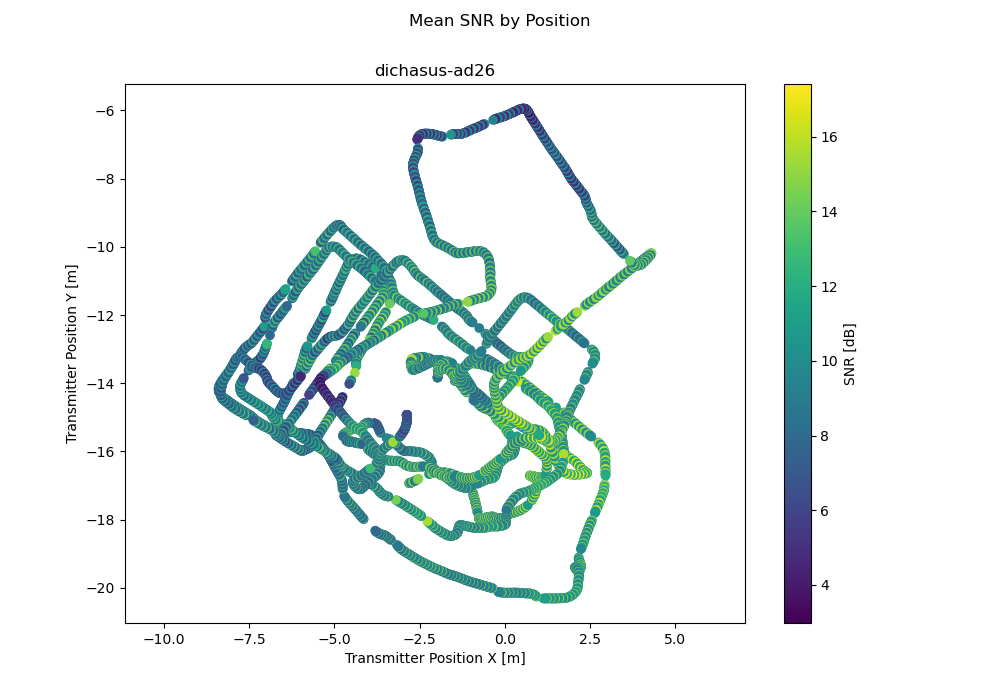
dichasus-ad26
Robot drives around near the metallic wall, higher robot speed.
File Size
Points
Duration
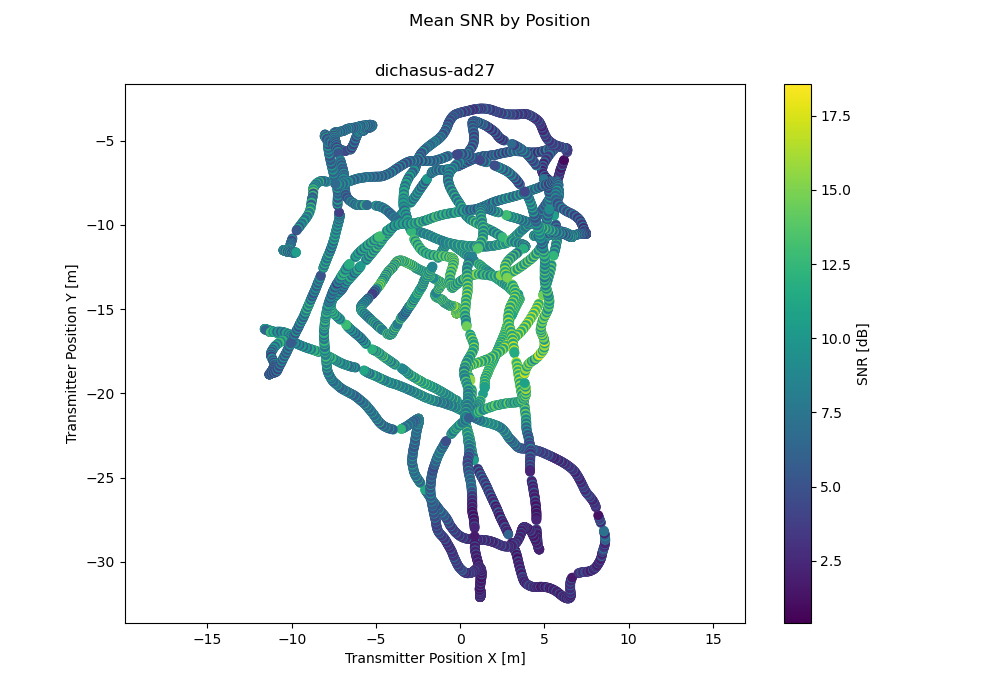
dichasus-ad27
Robot drives around in the whole measurement area, sometimes very close to the wall, very high robot speed.
File Size
Points
Duration
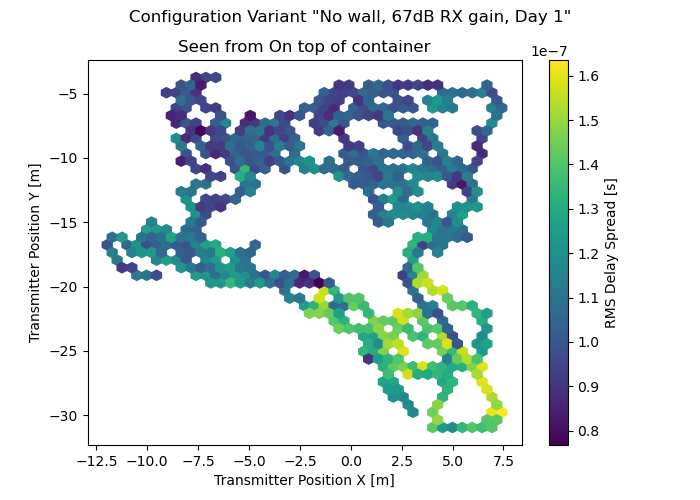
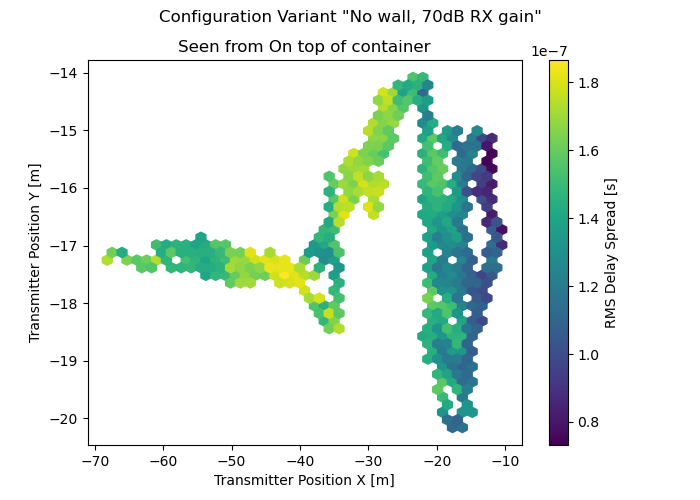
Derived Channel Statistics
Channel statistics such as delay spread, k-Factor and path loss exponent are a good way to characterize a wireless channel measurement and to parametrize a channel model. Using estimation algorithms contributed by Janina Sanzi, we automatically extract the following channel statistics from the measured datasets:
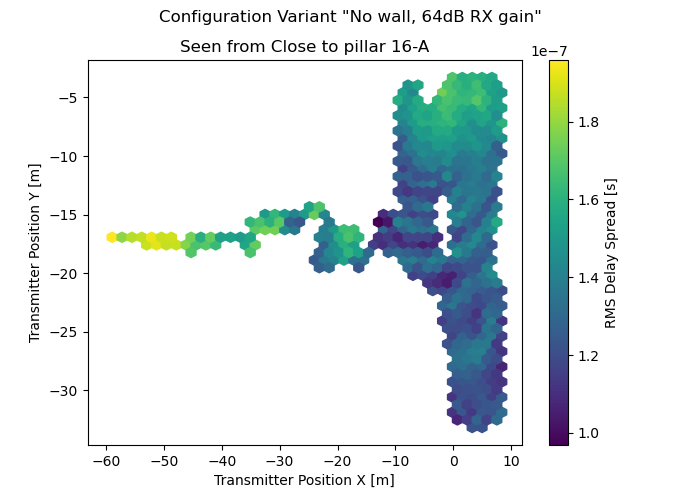
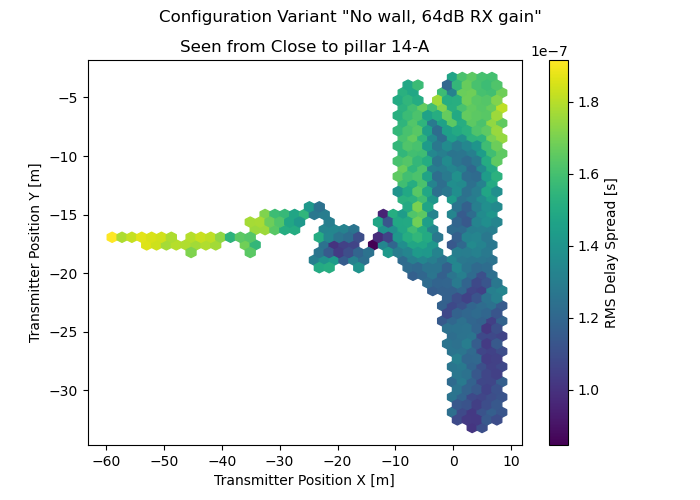
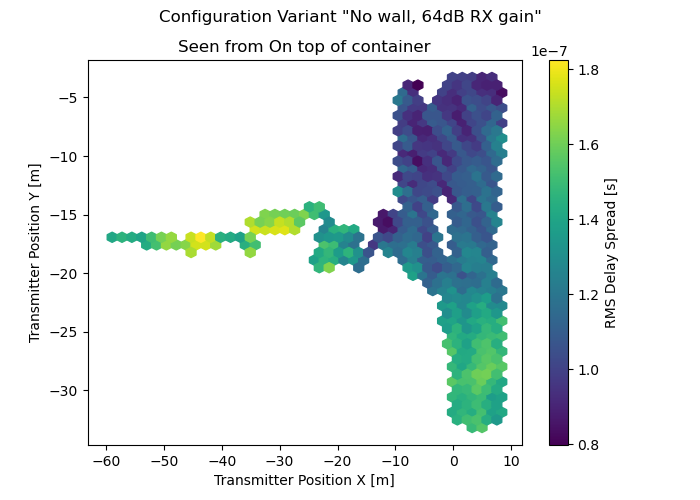
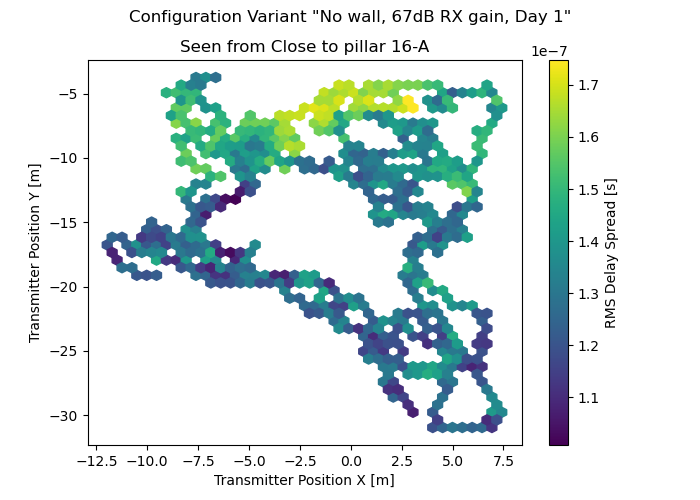
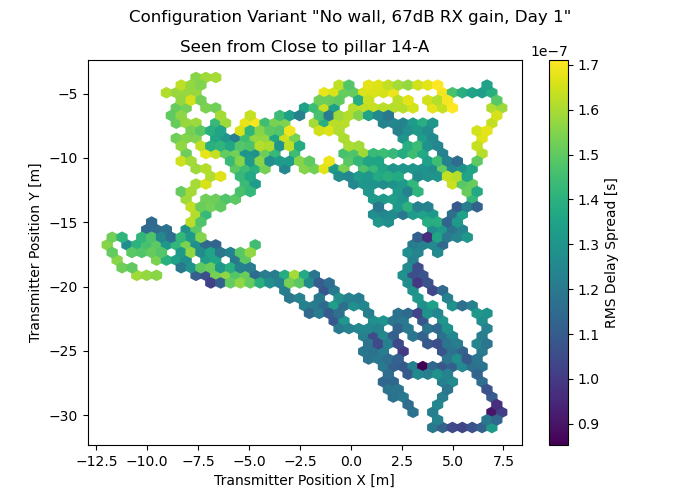
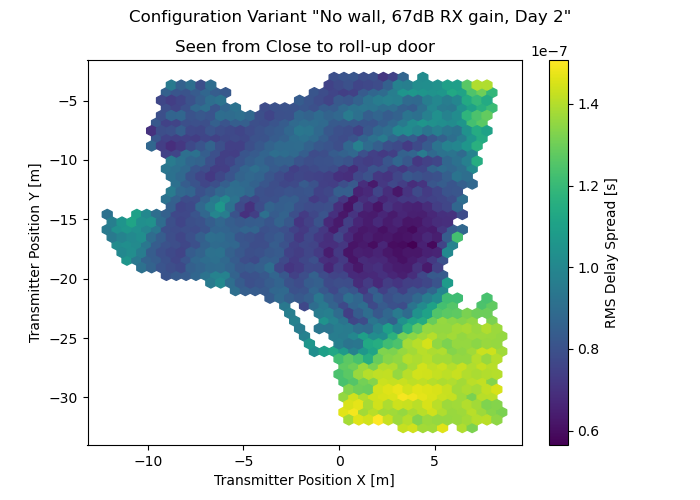
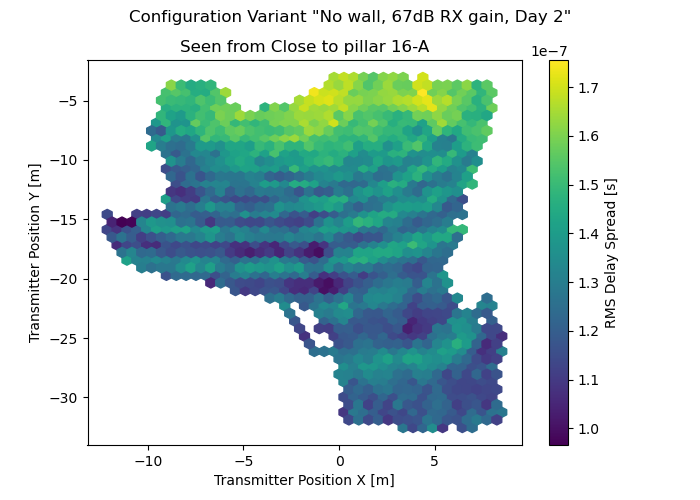
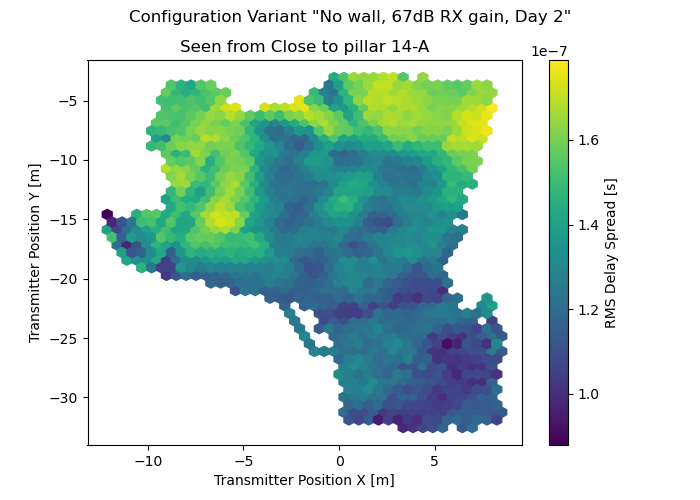
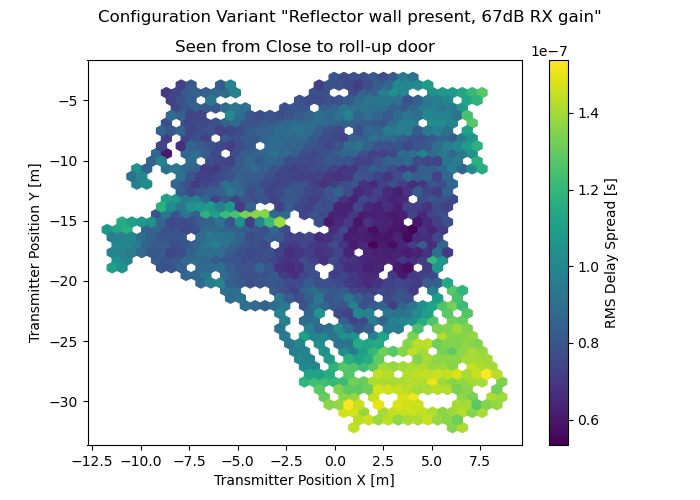
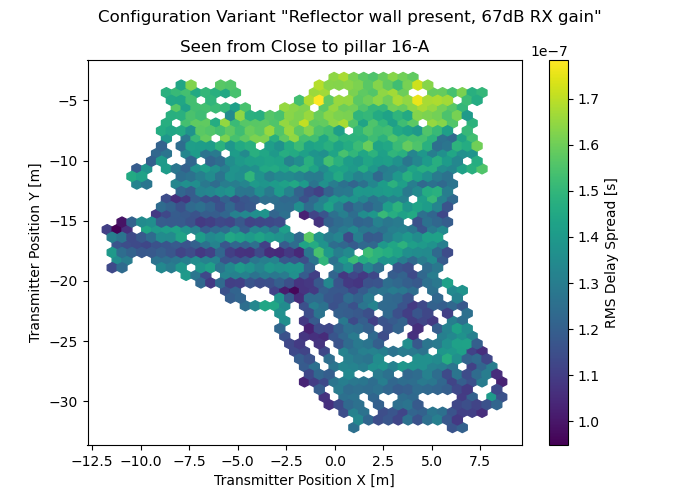
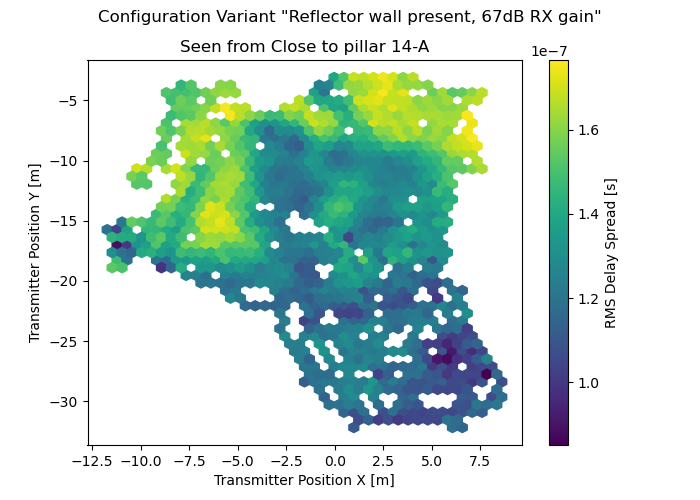
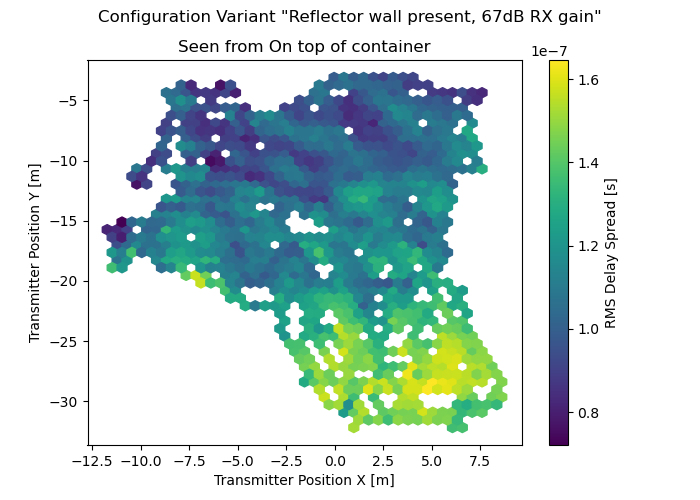
RMS Delay Spread
The delay spread of a wireless channel is inversely proportional to the channel's coherence bandwidth and indicates how "spread out" the lengths of the various multipath propagation paths are. For every datapoint, the delay spread can be characterized by its root mean square value and the resulting delay spreads can be plotted over the measurement area: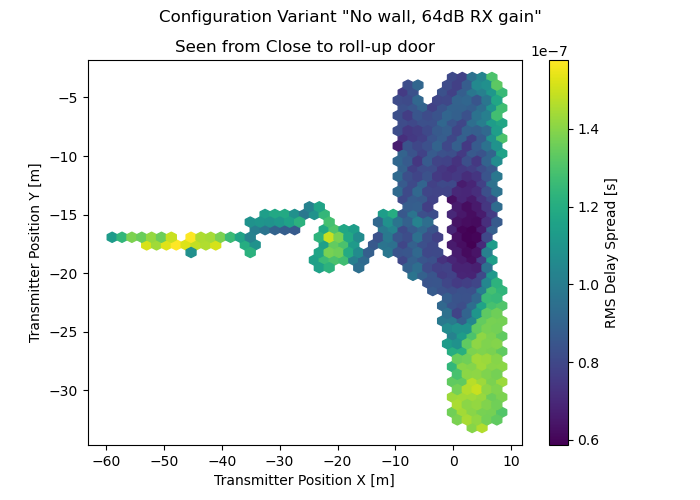

Rician K-Factor
The Rician K-factor is defined as the power ratio between dominant and diffuse component, usually expressed in decibels. We estimate the K-factor with a moment-method based on the distribution of of channel coefficient powers. The resulting K-Factors be plotted over the measurement area: